
Big Data: Algorithms for Data Preprocessing, Computational Intelligence, and Imbalanced Classes

The web is organized according to the following summary:
- Introduction to Big Data
- Big Data Technologies: Hadoop ecosystem and Spark
- Big Data preprocessing
- Imbalanced Big Data classification
- Big Data classification with fuzzy models
- Classification Algorithms: k-NN
- Big Data Applications
- Dataset Repository
- Literature review: surveys and overviews
- Keynote slides
- Links of interest
This Website contains SCI2S research material on algorithms for data preprocessing, computational intelligence and classification with imbalanced datasets in the scenario of Big Data. All information shown here is related to the following SCI2S journal papers and algorithms developed:
-
S. Ramírez-Gallego, A. Fernández, S. García, M. Chen, F. Herrera. Big Data: Tutorial and Guidelines on Information and Process Fusion for Analytics Algorithms with MapReduce. Information Fusion 42 (2018) 51-61. doi: 10.1016/j.inffus.2017.10.001

-
S. Ramírez-Gallego, S. García, , J.M. Benítez, F. Herrera. A distributed evolutionary multivariate discretizer for Big Data processing on Apache Spark. Swarm and Evolutionary Computation 38 (2018) 240-250. doi: 10.1016/j.swevo.2017.08.005
- S. Ramírez-Gallego, H. Mouriño-Talín, D. Martínez-Rego, V. Bolón-Canedo, J.M. Benítez, A. Alonso-Betanzos, F. Herrera. An Information Theoretic Feature Selection Framework for Big Data under Apache Spark. IEEE Transactions on Systems, Man, and Cybernetics: Systems, in press (2017), doi: 10.1109/TSMC.2017.2670926.
-
S. Ramírez-Gallego, B. Krawczyk, S. García, M. Wozniak, J.M. Benítez, F. Herrera. Nearest Neighbor Classification for High-Speed Big Data Streams Using Spark. IEEE Transactions on Systems, Man, and Cybernetics: Systems 47:10 (2017) 2727-2739, doi: 10.1109/TSMC.2017.2700889.
-
A. Fernández, S. Río, N.V. Chawla, F. Herrera. An insight into imbalanced Big Data classification: outcomes and challenges. Complex & Intelligent Systems, 3:2 (2017) 105-120 (2017), doi: 10.1007/s40747-017-0037-9.
- A. Fernandez, S. Río, F. Herrera. Fuzzy Rule Based Classification Systems for Big Data with MapReduce: Granularity Analysis. Advances in Data Analysis and Classification, 11 (2017) 711-730. doi: 10.1007/s11634-016-0260-z.
-
P. D. Gutiérrez, M. Lastra, J.M. Benítez, F. Herrera. SMOTE-GPU: Big Data preprocessing on commodity hardware for imbalanced classification. Progress in Artificial Intelligence 6:4 (2017) 347–354 doi: 10.1007/s13748-017-0128-2
-
D. García-Gil, J. Luengo, S. García, F Herrera. Enabling Smart Data: Noise filtering in Big Data classification, arXiv preprint (2017) arXiv:1704.01770
- D. García-Gil, S. Ramírez-Gallego, S. García, F. Herrera. A comparison on scalability for batch big data processing on Apache Spark and Apache Flink. Big Data Analytics 2:1 (2017), doi: 10.1186/s41044-016-0020-2
-
S. Ramírez‐Gallego, I. Lastra, D. Martínez‐Rego, V. Bolón‐Canedo, J.M. Benítez, F. Herrera, A. Alonso-Betanzos. Fast‐mRMR: Fast Minimum Redundancy Maximum Relevance Algorithm for High‐Dimensional Big Data. International Journal of Intelligent Systems 32:2 (2017), 134-152, doi: 10.1002/int.21833.
- J. Maillo, S. Ramírez-Gallego, I. Triguero, F. Herrera. kNN-IS: An Iterative Spark-based design of the k-Nearest Neighbors classifier for big data. Knowledge-Based Systems 117 (2017), 3-15 doi: 10.1016/j.knosys.2016.06.012
-
F. Herrera. Big Data: Preprocesamiento y calidad de datos. Novática 237 (2016) 17-23.
-
I. Triguero, J. Maillo, J. Luengo, S. García, F. Herrera. From Big data to Smart Data with the K-Nearest Neighbours algorithm. Internet of Things (iThings) and IEEE Green Computing and Communications (2016) 859-864
-
S. García, S. Ramírez-Gallego, J. Luengo, J.M. Benítez, F. Herrera. Big data preprocessing: methods and prospects. Big Data Analytics 1:9 (2016), doi: 10.1186/s41044-016-0014-0.
- A. Fernandez, C.J. Carmona, M.J. del Jesus, F. Herrera. A View on Fuzzy Systems for Big Data: Progress and Opportunities. International Journal of Computational Intelligence Systems, 9:1 (2016), 69-80 doi: 10.1080/18756891.2016.1180820.
- S. Ramírez-Gallego, S. García, H. Mouriño Talín, D. Martínez-Rego, V. Bolón-Canedo, A. Alonso-Betanzos, J. M. Benítez, F. Herrera. Data discretization: taxonomy and big data challenge. Wiley Interdisciplinary Reviews: Data Mining and Knowledge Discovery 6:1 (2016) 5-21. doi: 10.1002/widm.1173.
- P.D. Gutiérrez, M. Lastra, J. Bacardit, J.M. Benítez, F. Herrera. GPU-SME-kNN: Scalable and Memory Efficient kNN and Lazy Learning using GPUs. Information Sciences 373 (2016) 165-182.
- D. Galpert, S. Río, F. Herrera, E. Ancede-Gallardo, A. Antunes, G. Agüero-Chapin. An Effective Big Data Supervised Imbalanced Classification Approach for Ortholog Detection in Related Yeast Species. BioMed Research International, vol. 2015, Article ID 748681, 12 pages, 2015. doi: 10.1155/2015/748681
- D. Peralta, S. Río, S. Ramírez-Gallego, I. Triguero, J.M. Benítez, F. Herrera. Evolutionary Feature Selection for Big Data Classification: A MapReduce Approach. Mathematical Problems in Engineering, vol. 2015, Article ID 246139, 11 pages, 2015, doi: 10.1155/2015/246139
- I. Triguero, S. Río, V. López, J. Bacardit, J.M. Benítez, F. Herrera. ROSEFW-RF: The winner algorithm for the ECBDL'14 Big Data Competition: An extremely imbalanced big data bioinformatics problem. Knowledge-Based Systems 87 (2015) 69-79. doi: 10.1016/j.knosys.2015.05.027
- S. Río, V. López, J.M. Benítez, F. Herrera. A MapReduce Approach to Address Big Data Classification Problems Based on the Fusion of Linguistic Fuzzy Rules. International Journal of Computational Intelligence Systems 8:3 (2015) 422-437. doi: 10.1080/18756891.2015.1017377
- I. Triguero, D. Peralta, J. Bacardit, S. García, F. Herrera. MRPR: A MapReduce Solution for Prototype Reduction in Big Data Classification. Neurocomputing 150 (2015), 331-345. doi: 10.1016/j.neucom.2014.04.078
- V. López, S. Río, J.M. Benítez, F. Herrera. Cost-Sensitive Linguistic Fuzzy Rule Based Classification Systems under the MapReduce Framework for Imbalanced Big Data. Fuzzy Sets and Systems 258 (2015) 5-38. doi: 10.1016/j.fss.2014.01.015
- S. Río, V. López, J.M. Benítez, F. Herrera. On the use of MapReduce for Imbalanced Big Data using Random Forest. Information Sciences 285 (2014) 112-137. doi: 10.1016/j.ins.2014.03.043
- A. Fernandez, S. Río, V. López, A. Bawakid, M.J. del Jesus, J.M. Benítez, F. Herrera. Big Data with Cloud Computing: An Insight on the Computing Environment, MapReduce and Programming Frameworks. WIREs Data Mining and Knowledge Discovery 4:5 (2014) 380-409. doi: 10.1002/widm.1134
Throughout this Website, we have also included the source code for the algorithms associated with the former papers, as well as new approaches that are under development. Readers may find the implementations in the corresponding Github and Spark Packages links placed in those sections devoted to describe each framework. Both are marked with the corresponding logo:
![]()
![]()
Introduction to Big Data
Recently, the term of Big Data has been coined referring to those challenges and advantages derived from collecting and processing vast amounts of data (V. Marx. The big challenges of big data. Nature, 498(7453):255-260, 2013). This topic has appeared since organizations must deal with petabyte-scale collections of data. In fact, in the last two years we have produced 90% of the total data generated in history (X. Wu, X. Zhu, G.-Q. Wu, and W. Ding. Data mining with big data. IEEE Trans. Knowl. Data Eng., 26(1):97-107, 2014). The sources of such huge quantity of information are those applications which gather data from click streams, transaction histories, sensors, and elsewhere. However, the first problem for the correct definition of "Big Data" is the name itself (T. Kraska. Finding the needle in the big data systems haystack. IEEE Internet Comput., 17(1):84-86, 2013), as we might think that it is just related to the data Volume.
The heterogeneous structure, diverse dimensionality, and Variety of the data representation, has also significance on this issue. Just think about the former applications which carry out the data recording: different software implementations will lead to different schemes and protocols (T. Schlieski and B.D. Johnson. Entertainment in the age of big data. Proceedings of the IEEE, 100(Centennial-Issue):1404-1408, 2012).
Of course it also depends on the computational time, i.e. the efficiency and Velocity in both receiving and processing the data. Current users demand a "tolerable elapsed time" for receiving an answer. We must put this term in relationship with the available computational resources, as we cannot compare the power of a personal computer with respect to a computational server of a big corporation (S. Madden. From databases to big data. IEEE Internet Comput., 16(3):4-6, 2012).
All these facts are known as the 3V's of Big Data (Figure 1), which lead to the definition given by Steve Todd at Berkeley University:
Big data is when the normal application of current technology does not enable users to obtain timely, cost-effective, and quality answers to data-driven questions.
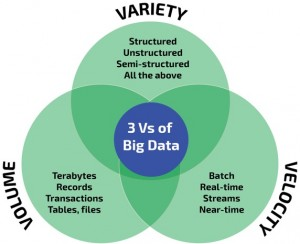
Figure 1. The 3 Vs of Big Data
We must point out that additional definitions including up to 9V's can be also found, adding terms like Veracity, Value, Viability, and Visualization, among others (P.C. Zikopoulos, C. Eaton, D. deRoos, T. Deutsch, and G. Lapis. Understanding Big Data - Analytics for Enterprise Class Hadoop and Streaming Data. McGraw-Hill Osborne Media, 1st edition, 2011).
The main challenge when addressing Big Data is associated with two main features (A. Labrinidis and H.V. Jagadish. Challenges and opportunities with big data. PVLDB, 5(12):2032-2033, 2012):
- The storage and management of large volumes of information. This issue is related to DBMS, and the traditional entity-relation model. Commercial systems report to scale well, being able to handle multi-petabyte databases, but in addition to their "cost" in terms of price and hardware resources, they have the constraint of importing data into a native representation. On the other hand, widely adopted open source systems, such as MySQL, are much more limited in terms of scalability than their commercial analytics counterparts.
- The process for carrying out the exploration of these large volumes of data, which intends to discover useful information and knowledge for future actions (X. Wu, X. Zhu, G.-Q. Wu, and W. Ding. Data mining with big data. IEEE Trans. Knowl. Data Eng., 26(1):97-107, 2014). The standard analytical processing is guided by an entity-relation scheme, from which queries were formulated using the SQL language. The first hitch of these type of systems is the necessity of preloading the data, as stated previously. Additionally, there is not much support for in-database statistics and modeling, and many DM programmers may not be comfortable with the SQL declarative style. Even in the case that engines provide these functionalities, since iterative algorithms are not easily expressible as parallel operations in SQL, they do not work well for massive quantities of data.
In summary, there are several conditions that must be taken into account in order to consider a problem within the Big Data framework. First of all, and referring to the 3Vs' properties, a threshold for the quantity of information that is being processed, and the time constraints for giving an answer, must be established. These two concepts are also closely related. For example, if we address the fingerprint recognition application, there is a limit for the number of fingerprints we can manage in the database for providing an accurate answer within a short period of time, i.e. tenths of a second or few seconds.
But, how do we set this limit? The answer is unclear as what was "big" years ago, can now be considered as "small". Therefore, for a clear definition of Big Data we must also include which technology is necessary to solve the problem. Suppose a major sales enterprise, which aims to adjust the unit pricing for a collection of items based on demand and inventory. Clearly, this firm will need a computational technology beyond a standard cluster of machines with a relational database and a common business analytics product. Now, if we consider a project of similar ambitions within the domain of a retailer company, the application could easily be completed using existing databases and ETL tools. The latter cannot be categorized as Big Data project, according to our definition.
Finally, Big Data is about the insight that we want to extract from information. There are many well-known applications that are based on Cloud Computing such as email servers (Gmail), social media (Twitter), or storage sharing and backup (Dropbox). All this software manage high volumes of data, where fast responses are essential, and with information coming at a high rate in a semistructured or unstructured way. They must also face the veracity in the information; however, they are not intrinsically considered Big Data.
The key here is the analysis that is made for knowledge and business purposes, what is known as Data Science (F. Provost and T. Fawcett. Data Science for Business. What you need to know about data mining and data-analytic thinking. O'Reilly Media, 1st edition, 2013). This speciality include several fields such as statistics, machine learning, DM, artificial intelligence, and visualisation, among others. Hence, Big Data and Data Science are two terms with a high synergy between them (MA Waller, SE Fawcett . Data science, predictive analytics, and big data: a revolution that will transform supply chain design and management. J Bus Logistics 2013, 34:77-84). Some well-known examples include e-Sciences and other related scientific disciplines (particle physics, bioinformatics, medicine or genomics) Social Computing (social network analysis, online communities or recommender systems), and large-scale e-commerce, all of which are particularly data-intensive.
Regarding the former, many Big Data challenges proliferate nowadays for encouraging researchers to put their efforts in solving these kind of tasks. As examples, we may refer to the "Data Mining Competition 2014", which belongs to the Evolutionary Computation for Big Data and Big Learning Workshop (a part of the well-known GECCO conference), and the three "DREAM9" challenges opened by Sage Bionetworks and DREAM, linked to the International Biomedical Commons Congress and the RECOMB/ISCB Systems and Regulatory Genomics/DREAM Conference.
Big Data Technologies: Hadoop ecosystem and Spark
1. Introduction
2. Hadoop ecosystem
3. Apache SPARK framework
Introduction to MapReduce
The best known example of Big Data execution environment is probably Google MapReduce (Dean, J. and Ghemawat, S. (2008). MapReduce: simplified data processing on large clusters. Commun. ACM, 51(1):107-113) (the Google's implementation of the MapReduce programming model) and Hadoop, its open source version (Lam, C. (2011). Hadoop in action. Manning, 1st edition). This environment aims at providing elasticity by allowing the adjustment of resources according to the application, handling errors transparently and ensuring the scalability of the system.
As its name suggests, this programming model is built upon two "simple" abstract functions named Map and Reduce, which are inherited from the classical functional programming paradigms. Users specify the computation in terms of a map (that specify the per-record computation) and a reduce (that specify result aggregation) functions, which meet a few simple requirements. For example, in order to support these, MapReduce requires that the operations performed at the reduce task to be both "associative" and "commutative." This two-stage processing structure is illustrated in Figure 2
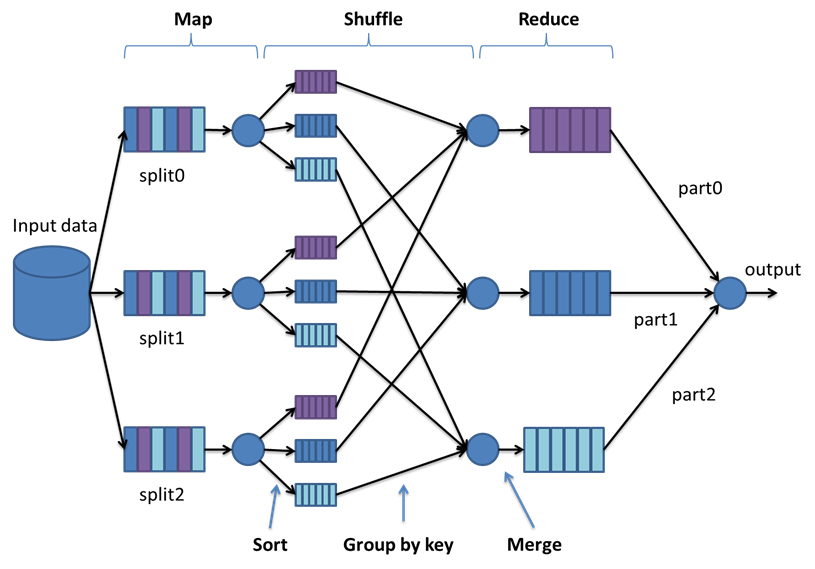
Figure 2. MapReduce simplified flowchart
We will focus on the Hadoop MapReduce implementation (Lam, C. (2011). Hadoop in action. Manning, 1st edition) for its wider usage and popularity due to its performance, open source nature, installation facilities and its distributed file system. This fact is quite important to remark, as we may distinguish between MapReduce (the theoretical framework) and Hadoop MapReduce (the world-wide open source implementation). Additionally, we will describe SPARK (Zaharia, M., Chowdhury, M., Das, T., Dave, A., Ma, J., McCauley, M., Franklin, M.~J., Shenker, S., and Stoica, I. (2012). Resilient distributed datasets: A fault-tolerant abstraction for in-memory cluster computing. In 9th USENIX Conference on Networked Systems Design and Implementation, NSDI'12, pages 1-14), a novel programming model which aims at providing faster response times than Hadoop for iterative-based algorithms.
 Hadoop Ecosystem
The MapReduce framework is based on the fact that most of the information processing tasks consider a similar structure, i.e. the same computation is applied over a large number of records; then, intermediate results are aggregated in some way. As it was previously described, the programmer must specify the Map and Reduce functions within a job. Then, the job usually divides the input dataset into independent subsets that are processed in parallel by the Map tasks. MapReduce sorts the different outputs of the Map tasks which become the inputs that will be processed by the Reduce task. The main components of this programming model, that were previously illustrated in Fig. 1, are the following ones:
- The job input is usually stored on a distributed file system. The master node performs a segmentation of the input dataset into independent blocks and distributes them to the worker nodes. Next, each worker node processes the smaller problem, and passes the answer back to its master node. This information is given in terms of \emph{$<$key,value$>$ pairs} which form the processing primitives.
- The former input $<$key,value$>$ pairs are split and distributed among the available Map tasks. Specifically, Map invocations are distributed across multiple machines by automatically partitioning the input data into a set of M splits. The input splits can be processed in parallel by different machines. Then, Map-functions emit a set of intermediate $<$key,values$>$ pairs as output. Before the execution of a Reduce function, MapReduce groups all intermediate values associated with the same intermediate key ($<$key,list(values)$>$ and transforms them to speed up the computation in the Reduce function.
- The intermediate values are supplied to the user's Reduce function via an iterator, which allows to handle lists of values that are too large to fit in memory. In particular, Reduce invocations are distributed by partitioning the intermediate key space into R pieces using a partitioning function (e.g., hash(key) module R). The number of partitions (R) and the partitioning function are specified by the user. Finally, the Reduce-functions generate an arbitrary number of final $<$key,values$>$ pairs as output.
The whole process can be summarized as follows: the master node collects the answers to all the sub-problems, sorts the Map task outputs by their keys, groups those that have the same key, and shuffles them among the available Reduce tasks using a dynamic scheduling mechanism. In this approach, the runtime assigns Map/Reduce tasks to the available computation resources simplifying the optimal utilization of heterogeneous computational resources while the initial assignment of Map tasks is performed based on the data locality. This approach also provides an automatic load balancing for Map tasks with skewed data or computational distributions.
An illustrative example about how MapReduce works could be finding the average costs per year from a big list of cost records. Each record may be composed by a variety of values, but it at least includes the year and the cost. The Map function extracts from each record the pairs $<$ year, cost $>$ and transmits them as its output. The shuffle stage groups the $<$ year, cost $>$ pairs by its corresponding year, creating a list of costs per year $<$ year, list(cost) $>$. Finally, the Reduce phase performs the average of all the costs contained in the list of each year.
Finally, we must stress the Mahout Machine Learning library (Owen, S., Anil, R., Dunning, T., and Friedman, E. (2011). Mahout in Action. Manning Publications Co., 1st edition). It contains scalable machine learning implementations written in Java and built mainly upon Apache's Hadoop distributed computation project. First of all, we must point out two significant issues: (1) On the one hand, it is just a library. This means that it does not provide a user interface, a prepackaged server, or an installer. It is a simply framework of tools intended to be used and adapted by developers. (2) On the second hand, it is still under development (currently is under version 0.9). It is a quite recent approach and it is far from being thoroughly documented. However, it includes a wide amount of methods and it is continuously in expansion with new DM approaches. Currently, it supports the aforementioned main kind of learning tasks. It addition, it includes dimension reduction techniques, and other miscellaneous approaches, all of which are summarized in Table 1.
| Type of Task | List of algorithms |
|---|---|
| Classification | Naive Bayes/ Complementary Naive Bayes; Multilayer Perceptron; Random Forest; Logistic Regression; Hidden Markov Models |
| Clustering | Canopy Clustering; k-Means Clustering; Fuzzy k-Means; Streaming k-Means; Spectral Clustering |
| Collaborative Filtering | User-Based Collaborative Filtering; Item-Based Collaborative Filtering; Matrix Factorization with Alternating Least Squares; Weighted Matrix Factorization; SVD++; Parallel SGD |
| Dimension reduction | Singular Value Decomposition; Stochastic Singular Value Decomposition; Principal Components Analysis; Lanczos algorithm; Topic Models; Latent Dirichlet Allocation |
| Miscellaneous | Frequent Pattern Mining; RowSimilarityJob - compute pairwise similarities between the rows of a matrix; ConcatMatrices - combine 2 matrices or vectors into a single matrix; Collocations - find co-locations of tokens in text |
In April 2014, Mahout has said goodbye to MapReduce. The justification for this change is two-fold: on the one hand organizational issues, as it was onerous to provide support for scalable ML; on the other hand, technical considerations, as MapReduce is not so well suited for ML, mainly due to
the launching overhead, especially noticeable for iterative algorithms, different quality of implementations, and/or and the unsuitability of some methods to be codified as Map and Reduce operations.
Hence, the future of Mahout is the usage of modern parallel processing systems which offer richer programming models and more efficient executions, while maintaining the underlying HDFS. The answer to these constraints is Apache SPARK (Zaharia, M., Chowdhury, M., Franklin, M.~J., Shenker, S., and Stoica, I. (2010). Spark: Cluster computing with working sets. In HotCloud 2010, pages 1-7) , which will be also described in detail in the following section. In this way, future implementations will use the DSL linear algebraic operations following Scala & Spark Bindings. These are basically similar to R (Matlab)-like semantics, allowing automatic optimization and parallelization of programs.
 Apache Spark framework
We have stressed the goodness of MapReduce as a powerful solution designed to solve different kinds of Big Data problems. However, it is not a panacea: there are some scenarios in which this functional programming model does not achieve the expected performance, and therefore alternative solutions must be chosen. In particular, among all possible deficiencies of MapReduce, the greatest critic reported is the implementation of iterative jobs (Lin, J. (2013). Mapreduce is good enough? Big Data, 1(1):BD28-BD37). In fact, many common machine learning algorithms apply a function repeatedly to the same dataset to optimize a parameter. The input to any Hadoop MapReduce job is stored on the HDFS. Hence, whenever a job is executed, the input has to be reload the data from disk every time. This is done regardless of how much of the input has changed from the previous iterations, incurring in a significant performance penalty.
In this sense, SPARK (Zaharia, M., Chowdhury, M., Franklin, M.~J., Shenker, S., and Stoica, I. (2010). Spark: Cluster computing with working sets. In HotCloud 2010, pages 1-7) and SPARK2 (Zaharia, M., Chowdhury, M., Das, T., Dave, A., Ma, J., McCauley, M., Franklin, M.~J., Shenker, S., and Stoica, I. (2012). Resilient distributed datasets: A fault-tolerant abstraction for in-memory cluster computing. In 9th USENIX Conference on Networked Systems Design and Implementation, NSDI'12, pages 1-14) are developed to overcome data reuse across multiple computations. It supports iterative applications, while retaining the scalability and fault tolerance of MapReduce, supporting in-memory processes. Among them, we outline some of most important of those operators:
- Filter(func) Return a new dataset formed by selecting those elements of the source on which the function agrees.
- SortByKey([ascending], [numTasks]): A distributed version of sequential sorting. It sorts by key the values in each partition and then sorts the partitions.
With this aim, the authors include a new abstraction model called Resilient Distributed Datasets (RDDs), which are simply a distributed collection of items. RDDs are fault-tolerant, parallel data structures that let users explicitly persist intermediate results in memory, control their partitioning to optimize data placement. In a nutshell, it provides a restricted form of shared memory based on coarse-grained transformations rather than fine-grained updates to shared state. RDDs can either be cached in memory or materialized from permanent storage when needed (based on lineage, which is the sequence of transformations applied to the data). Additionally, Spark provides a wider range of primitives than exposed by MapReduce framework. Those extend the idea of MapReduce to implement more complex operations on distributed data.
Similar to Mahout for Hadoop (Owen, S., Anil, R., Dunning, T., and Friedman, E. (2011). Mahout in Action. Manning Publications Co., 1st edition), Spark implements a Machine Learning library known as MLlib, included within the MLBase platform (Kraska, T., Talwalkar, A., J.Duchi, Griffith, R., Franklin, M., and Jordan, M. (2013). Mlbase: A distributed machine learning system. In Conference on Innovative Data Systems Research, pages 1-7). MLlib currently supports common types of machine learning problem settings, as well as associated tests and data generators. It includes binary classification, regression, clustering and collaborative filtering, as well as an underlying gradient descent optimization primitive.
 Big Data Preprocessing
1. Introduction to Data Preprocessing
2. Feature Selection
3. Feature Weighting
4. Discretization
5. Prototype Generation
Introduction to Data Preprocessing
Data preprocessing is a crucial research topic in Data Mining (DM) since most real-world databases are highly influenced by negative elements such as the presence of noise, missing values, inconsistent and superfluous data. A complete Website with information regarding this topic can be accessed through the Webpage associated to the book S. García, J. Luengo, and F. Herrera, Data Preprocessing in Data Mining. Springer, (2015) clicking on the following figure:

The reduction of data is also an essential task especially when dealing with large data sets, focusing on the selection or extraction of the most informative features or instances in the data.. During the last few decades, the dimensionality of datasets employed in DM tasks has significantly increased. This presents an unprecedented challenge for researchers in these areas, since the existing algorithms not always respond in an adequate time when dealing with this new extremely high dimensions (both in number of features and instances). Exceptional technologies, paradigms and algorithms are thus needed to efficiently process these large quantities of data to obtain information, within tolerable elapsed times.
Feature Selection
With the advent of extremely high dimensional datasets, dimensionality reduction techniques are becoming mandatory. Among many techniques, feature selection is growing in interest as an important tool to identify relevant features on huge datasets; both in number of instances and features. From the beginning, data scientists have generally focused on only one side of Big Data, which early days refers to the huge number of instances; paying less attention to the feature side. Big Dimensionality (Zhai Y, Ong Y, Tsang IW (2014) The emerging “big dimensionality”. IEEE Comp Int Mag 9(3):14–26), though, calls for new feature selection strategies and methods that are able to deal with the feature explosion problem. It has been captured in many of the most famous dataset repositories in computational intelligence (like UCI or libSVM), where the majority of the new added datasets present a humongous dimensionality (in order of millions of features).
Isolating high value features from the raw set of features (potentially irrelevant, redundant and noisy), while maintaining the requirements in measurement and storage, is one of the most important tasks in Big Data research. In this field, we have developed some software packages in order to solve the aforementioned problem.
-
Evolutionary Feature Selection model based on MapReduce (MR-EFS)
This implements a feature selection algorithm based on evolutionary computation that uses the MapReduce paradigm to obtain subsets of features from big datasets. The algorithm decomposes the original dataset in blocks of instances to learn from them in the map phase; then, the reduce phase merges the obtained partial results into a final vector of feature weights, which allows a flexible application of the feature selection procedure using a threshold to determine the selected subset of features.
The former software is published in the following reference:
D. Peralta, S. Río, S. Ramírez-Gallego, I. Triguero, J.M. Benítez, F. Herrera. Evolutionary Feature Selection for Big Data Classification: A MapReduce Approach. Mathematical Problems in Engineering, vol. 2015, Article ID 246139, 11 pages, 2015, doi: 10.1155/2015/246139 ![]()
![]()

- An Information Theoretic Feature Selection Framework for Spark
This implements FS on Spark for its application on Big Data problems. This package contains a generic implementation of greedy Information Theoretic Feature Selection methods. The implementation is based on the common theoretic framework presented in (Peng, H.C., Long, F., and Ding, C., "Feature selection based on mutual information: criteria of max-dependency, max-relevance, and min-redundancy," IEEE Transactions on Pattern Analysis and Machine Intelligence, Vol. 27, No. 8, pp. 1226–1238, 2005). Implementations of mRMR, ICAP, JMI and other commonly used FS filters are provided. The journal publication for this package is under revision process.
![]()

![]()
- Fast-mRMR: an optimal implementation of minimum Redundancy Maximum Relevance algorithm:
This is an improved implementation of the classical feature selection method: minimum Redundancy and Maximum Relevance (mRMR); presented by Peng in (Hanchuan Peng, Fuhui Long, and Chris Ding "Feature selection based on mutual information: criteria of max-dependency, max-relevance, and min-redundancy," IEEE Transactions on Pattern Analysis and Machine Intelligence, Vol. 27, No. 8, pp.1226-1238, 2005.). This includes several optimizations such as: cache marginal probabilities, accumulation of redundancy (greedy approach) and a data-access by columns.
![]()

Feature Weighting
Feature weighting is a feature importance ranking technique where weights, not only ranks, are obtained. When successfully applied relevant features are attributed a high weight value, whereas irrelevant features are given a weight value close to zero. Feature weighting can be used not only to improve classification accuracy but also to discard features with weights below a certain threshold value and thereby increase the resource efficiency of the classifier.
To deal with the aforementioned scalability problems, we have developed the software described below:
- Random OverSampling and Evolutionary Feature Weighting for Random Forest (ROSEFW-RF).
This includes a feature weighting algorithm based on evolutionary computation that uses the MapReduce paradigm to obtain subsets of features from big datasets. The algorithm decomposes the original dataset in blocks of instances to learn from them in the map phase; then, the reduce phase merges the obtained partial results into a final vector of feature weights, which allows a flexible application of the feature selection procedure using a threshold to determine the selected subset of features.
This work has been published in the following reference:
I. Triguero, S. Río, V. López, J. Bacardit, J.M. Benítez, F. Herrera. ROSEFW-RF: The winner algorithm for the ECBDL'14 Big Data Competition: An extremely imbalanced big data bioinformatics problem. Knowledge-Based Systems 87 (2015) 69-79. doi: 10.1016/j.knosys.2015.05.027 ![]()

Discretization
Discretization is one of the most important tasks in data mining process, aimed at simplifying and reducing continuous-valued data in large datasets. In spite of the great interest in this reduction mechanism, only a few simple discretization techniques have been implemented in the literature for Big Data. Among its main benefits, discretization causes in learning methods remarkable improvements in learning speed and accuracy. Although most of real-world problems often imply numerical attributes, many algorithms can only handle categorical attributes, for example some feature selection methods (which are relevant in the Big Data picture).
Classical discretization methods are not expected to scale well when managing huge data -both in terms of features and instances- so that its application can be undermined or even become impracticable. To solve that, we have developed a software package described below:
- Distributed Minimum Description Length Discretizer for Spark
This package implements Fayyad's discretizer (Fayyad, U., & Irani, K. (1993). "Multi-interval discretization of continuous-valued attributes for classification learning.") based on Minimum Description Length Principle (MDLP) in order to treat non discrete datasets from a distributed perspective. We have developed a distributed version from the original one performing some important changes.
![]()

![]()
This work has been published in the following references:
- S. Ramírez-Gallego, S. García, H. Mouriño-Talin, D. Martínez-Rego, V. Bolón, A. Alonso-Betanzos, J.M. Benitez, F. Herrera. "Distributed Entropy Minimization Discretizer for Big Data Analysis under Apache Spark", The 9th IEEE International Conference on Big Data Science and Engineering (IEEE BigDataSE-15), Volume 2; Helsinki (Finland), 33-40, August 20-22, 2015. doi:10.1109/Trustcom.2015.559
- S. Ramírez-Gallego, S. García, H. Mouriño Talín, D. Martínez-Rego, V. Bolón-Canedo, A. Alonso-Betanzos, J. M. Benítez, F. Herrera. Data discretization: taxonomy and big data challenge. Wiley Interdisciplinary Reviews: Data Mining and Knowledge Discovery 6:1 (2016) 5-21. doi: 10.1002/widm.1173.
Prototype Generation
Prototype Reduction (PR) techniques (I. Triguero, J. Derrac, S. García, F. Herrera, A taxonomy and experimental study on prototype generation for nearest neighbor classification, IEEE Trans. Syst., Man, Cybern. Part C. Appl. Rev. 42 (1) (2012) 86–100.), which are instance reduction methods that aim to improve the classification capabilities of the Nearest Neighbor rule (NN). These techniques may select instances from the original data set, or build new artificial prototypes, to form a resulting set of prototypes that better adjusts the decision boundaries between classes in NN classification. The main problems found to deal with large-scale data are the following:
- Runtime: The complexity of PR models is O((n D)^2) or higher, where n is the number of instances and D the number of features. Although these techniques are only applied once, if this process takes too long, its application could become inoperable for real applications.
- Memory consumption: Most of PR methods need to store in the main memory many partial calculations, intermediate solutions, and/or also the entire dataset. When the dataset is too big, it could easily exceed the available RAM memory.
In this field, we have developed a MapReduce-based framework for PR based on the stratification procedure:
-
I. Triguero, D. Peralta, J. Bacardit, S. García, F. Herrera. MRPR: A MapReduce Solution for Prototype Reduction in Big Data Classification. Neurocomputing 150 (2015), 331-345. doi: 10.1016/j.neucom.2014.04.078
-
I. Triguero, D. Peralta, J. Bacardit, S. García, F. Herrera. A Combined MapReduce-Windowing Two-Level Parallel Scheme for Evolutionary Prototype Generation. In Proceedings on the WCCI 2014 IEEE World Congress on Computational Intelligence, IEEE Congress on Evolutionary Computation CEC'2014, Beijing (China), 6-11 July, pp. 3036-3043, 2014. doi: 10.1109/CEC.2014.6900490
![]()

This model was later enhanced with a windowing mechanism that accelerate the evolutionary prototype generation process.
- I. Triguero, D. Peralta, J. Bacardit, S. García, F. Herrera. A Combined MapReduce-Windowing Two-Level Parallel Scheme for Evolutionary Prototype Generation. In Proceeding on the WCCI 2014 IEEE World Congress on Computational Intelligence, IEEE Congress on Evolutionary Computation CEC'2014, Beijing (China), 6-11 July, pp. 3036-3043, 2014. doi: 10.1109/CEC.2014.6900490
Instance Selection
Instance Selection (IS) techniques (S. García, J. Derrac, J.R. Cano, F. Herrera. Prototype Selection for Nearest Neighbor Classification: Taxonomy and Empirical Study. IEEE Transactions on Pattern Analysis and Machine Intelligence 34:3 (2012) 417-435), which are data reduction methods like those based on prototype generation. PS methods select a subset of examples from the original training data. Depending on the strategy followed by the methods, they can remove noisy, redundant, and both kinds of examples. The main advantage indicated in PS methods is the capacity to choose relevant examples without generating new artificial data.
- A Nearest Neighbor Classifier for High-Speed Big Data Streams with Instance Selection
Spark-IS-streaming is an efficient nearest neighbor solution to classify fast and massive data streams using Apache Spark. It is formed by a distributed case-base and an instance selection method that enhances its performance and effectiveness. A distributed metric tree (based on M-trees) has been designed to organize the case-base and consequently to speed up the neighbor searches. This distributed tree consists of a top-tree (in the master node) that routes the searches in the first levels and several leaf nodes (in the slaves nodes) that solve the searches in next levels through a completely parallel scheme.
![]()
![]()
Imbalanced Big Data classification
 1. Introduction to imbalanced datasets
2. Analysis of preprocessing approaches for imbalanced big data classification
3. Analysis of the oversampling rate for extremely imbalanced big data
4. Evolutionary undersampling for imbalanced big data
Introduction to imbalanced datasets
In the classification problem field, the scenario of imbalanced datasets appears frequently. The main property of this type of classification problem is that the examples of one class significantly outnumber the examples of the other one (V. López, A. Fernandez, S. García, V. Palade, F. Herrera. An Insight into Classification with Imbalanced Data: Empirical Results and Current Trends on Using Data Intrinsic Characteristics. Information Sciences 250 (2013) 113-141). The minority class usually represents the most important concept to be learned, and it is difficult to identify it since it might be associated with exceptional and significant cases, or because the data acquisition of these examples is costly. In most cases, the imbalanced class problem is associated to binary classification, but the multi-class problem often occurs and, since there can be several minority classes, it is more difficult to solve (A. Fernández, V. López, M. Galar, M.J. del Jesus, F. Herrera, Analysing the classification of imbalanced data-sets with multiple classes: binarization techniques and ad-hoc approaches, Knowledge-Based Systems 42 (2013) 97–110).
Since most of the standard learning algorithms consider a balanced training set, this may generate suboptimal classification models, i.e. a good coverage of the majority examples, whereas the minority ones are misclassified frequently. Therefore, those algorithms, which obtain a good behavior in the framework of standard classification, do not necessarily achieve the best performance for imbalanced datasets (A. Fernandez, S. García, J. Luengo, E. Bernadó-Mansilla, F. Herrera, Genetics-based machine learning for rule induction: state of the art, taxonomy and comparative study, IEEE Transactions on Evolutionary Computation 14 (6) (2010) 913–941). There are several reasons behind this behavior:
- The use of global performance measures for guiding the learning process, such as the standard accuracy rate, may provide an advantage to the majority class.
- Classification rules that predict the positive class are often highly specialized and thus their coverage is very low, hence they are discarded in favor of more general rules, i.e. those that predict the negative class.
- Very small clusters of minority class examples can be identified as noise, and therefore they could be wrongly discarded by the classifier. On the contrary, few real noisy examples can degrade the identification of the minority class, since it has fewer examples to train with.
A large number of approaches have been proposed to deal with the class imbalance problem (H. He, E.A. Garcia, Learning from imbalanced data, IEEE Transactions on Knowledge and Data Engineering 21 (9) (2009) 1263–1284). These approaches can be categorized into two groups: the internal approaches that create new algorithms or modify existing ones to take the class-imbalance problem into consideration and external approaches that preprocess the data in order to diminish the effect of their class imbalance. Furthermore, cost-sensitive learning solutions incorporating both the data (external) and algorithmic level (internal) approaches assume higher misclassification costs for samples in the minority class and seek to minimize the high cost errors). Ensemble methods are also frequently adapted to imbalanced domains (M. Galar, A. Fernández, E. Barrenechea, H. Bustince, F. Herrera, A review on ensembles for class imbalance problem: bagging, boosting and hybrid based approaches. IEEE Transactions on Systems, Man, and Cybernetics – part C: Applications and Reviews 42:4 (2012) 463-484), either by modifying the ensemble learning algorithm at the data-level approach to preprocess the data before the learning stage of each classifier.
In the specialized literature, we can find some papers about resampling techniques studying the effect of changing the class distribution in order to deal with imbalanced datasets. Those works have proved empirically that applying a preprocessing step in order to balance the class distribution is usually an useful solution (G.E.A.P.A. Batista, R.C. Prati, M.C. Monard, A study of the behaviour of several methods for balancing machine learning training data, SIGKDD Explorations 6 (1) (2004) 20–29). Furthermore, the main advantage of these techniques is that they are independent of the underlying classifier.
Resampling techniques can be categorized into three groups or families:
- Undersampling methods, which create a subset of the original dataset by eliminating instances (usually majority class instances).
- Oversampling methods, which create a superset of the original dataset by replicating some instances or creating new instances from existing ones.
- Hybrids methods, which combine both sampling approaches from above.
Within these families of methods, the simplest preprocessing techniques are non-heuristic methods such as random undersampling and random oversampling. Their working procedure is very simple: they are devoted to randomly remove examples of the majority class, or replicate examples from the minority class. This process is carried out only in the training set with aims at rebalancing the data distribution to the 50%. In the first case, i.e. random undersampling, the major drawback is that it can discard potentially useful data, that could be important for the learning process. For random oversampling, several authors agree that this method can increase the likelihood of occurring overfitting, since it makes exact copies of existing instances.
In order to deal with the mentioned problems, more sophisticated methods have been proposed. Among them, the "Synthetic Minority Oversampling TEchnique" (SMOTE) (N.V. Chawla, K.W. Bowyer, L.O. Hall, W.P. Kegelmeyer, SMOTE: synthetic minority over-sampling technique, Journal of Artificial Intelligent Research 16 (2002) 321–357) has become one of the most renowned approaches in this area. In brief, its main idea is to create new minority class examples by interpolating several minority class instances that lie together for oversampling the training set.
With this technique, the positive class is over-sampled by taking each minority class sample and introducing synthetic examples along the line segments joining any/all of the k minority class nearest neighbors. Depending upon the amount of over-sampling required, neighbors from the k nearest neighbors are randomly chosen. This process is illustrated in Figure 3, where xi is the selected point, xi1 to xi4 are some selected nearest neighbors and r1 to r4 the synthetic data points created by the randomized interpolation.
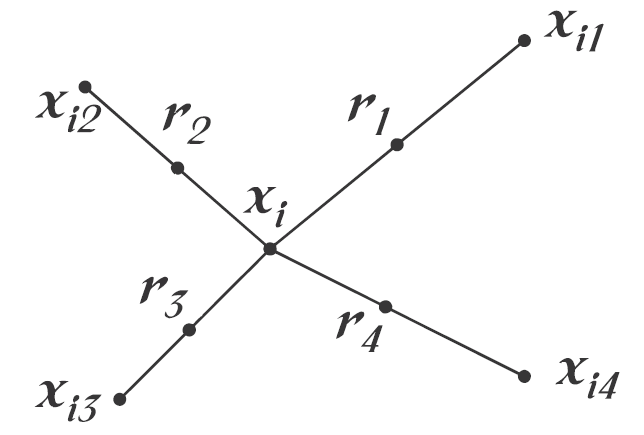
Figure 3. An illustration of how to create the synthetic data points in the SMOTE algorithm
Regarding undersampling, most of the proposed approaches are based on data cleaning techniques. Some representative works in this area include the Wilson's edited nearest neighbor (ENN) rule (D.L. Wilson, Asymptotic properties of nearest neighbor rules using edited data, IEEE Transactions on Systems, Man and Cybernetics 2 (3) (1972) 408–421. doi: 10.1109/TSMC.1972.4309137), which removes examples that differ from two of its three nearest neighbors, the one-sided selection (OSS) (M. Kubat, S. Matwin, Addressing the curse of imbalanced training sets: one-sided selection, in: Proceedings of the 14th International Conference on Machine Learning (ICML’97), 1997, pp. 179–186.), an integration method between the condensed nearest neighbor rule (P.E. Hart, The condensed nearest neighbor rule, IEEE Transactions on Information Theory 14 (1968) 515–516. doi: 10.1109/TIT.1968.1054155) and Tomek Links (I. Tomek, Two modifications of CNN, IEEE Transactions on Systems Man and Communications 6 (1976) 769–772. doi: 10.1109/TSMC.1976.4309452) and the neighborhood cleaning rule (J. Laurikkala, Improving identification of difficult small classes by balancing class distribution, in: Proceedings of the 8th Conference on AI in Medicine in Europe: Artificial Intelligence Medicine (AIME’01), 2001, pp. 63–66.), which is based on the ENN technique.
On the other hand, cost-sensitive learning takes into account the variable cost of a misclassification with respect to the different classes (P. Domingos, Metacost: a general method for making classifiers cost–sensitive, in: Proceedings of the 5th International Conference on Knowledge Discovery and Data Mining (KDD’99), 1999, pp. 155–164). In this case, a cost matrix codifies the penalties C(i,j) of classifying examples of one class i as a different one j. These misclassification cost values can be given by domain experts, or can be learned via other approaches (Y. Sun, M.S. Kamel, A.K.C. Wong, Y. Wang, Cost-sensitive boosting for classification of imbalanced data, Pattern Recognition 40 (12) (2007) 3358–3378.; Y. Sun, A.K.C. Wong, M.S. Kamel, Classification of imbalanced data: a review, International Journal of Pattern Recognition and Artificial Intelligence 23 (4) (2009) 687–719). Specifically, when dealing with imbalanced problems, it is usually more interesting to recognize the positive instances rather than the negative ones. Therefore, the cost when misclassifying a positive instance must be higher than the cost of misclassifying a negative one, i.e. C(+,-) > C(-,+).
Given the cost matrix, an example should be classified into the class that has the lowest expected cost, which is known as the minimum expected cost principle. The expected cost R(i|x) of classifying an instance x into class i (by a classifier) can be expressed as:
$$R(i|x)=\sum_{j}P(j|x)·C(i,j)$$
where P(j|x) is the probability estimation of classifying an instance into class j. That is, the classifier will classify an instance x into positive class if and only if:
$$P(0|x)·C(1,0)+P(1|x)·C(1,1) \le P(0|x) · C(0,0)+P(1|x)·C(0,1)$$
or, which is equivalent:
$$P(0|x)·(C(1,0)-C(0,0)) \le P(1|x)(C(0,1)-C(1,1)$$
Therefore, any given cost-matrix can be converted to one with C(0,0) = C(1,1) = 0. Under this assumption, the classifier will classify an instance x into positive class if and only if:
$$P(0|x)·C(1,0) \le P(1|x)·C(0,1)$$
As P(0|x) = 1 - P(1|x), we can obtain a threshold p* for the classifier to classify an instance x into positive if P(1|x) > p*, where
$$p^*=\frac{C(1,0)}{C(1,0)-C(0,1)}=\frac{FP}{FP+FN}$$
Another possibility is to "rebalance" the original training examples the ratio of:
p(1)FN : p(0)FP
where p(1) and p(0) are the prior probability of the positive and negative examples in the original training set.
In summary, two main general approaches have been proposed to deal with cost-sensitive problems:
- Direct methods: The main idea of building a direct cost-sensitive learning algorithm is to directly introduce and utilize misclassification costs into the learning algorithms. For example, in the context of decision tree induction, the tree-building strategies are adapted to minimize the misclassification costs.
- Meta-learning: This methodology implies the integration of a "preprocessing" mechanism for the training data or a "postprocessing" of the output, in such a way that the original learning algorithm is not modified. Cost-sensitive meta-learning can be further classified into two main categories: thresholding and sampling, which are based on the two last expressions presented respectively.
Analysis of preprocessing approaches for imbalanced big data classification
In this part of the website, we first present a study on preprocessing for Big Data in imbalanced classification, associated with the following paper:
- S. Río, V. López, J.M. Benítez, F. Herrera. On the use of MapReduce for Imbalanced Big Data using Random Forest. Information Sciences 285 (2014) 112-137. doi: 10.1016/j.ins.2014.03.043
We have adapted several techniques to deal with imbalanced big data following a MapReduce scheme. Concretely, we have developed data sampling techniques such as random oversampling, random undersampling, the "Synthetic Minority Oversampling TEchnique" (SMOTE) algorithm and cost-sensitive learning. For each one of them, we will present an approach based on the MapReduce framework. In what follows, we briefly present the models that have been developed. Additionally, we will include a short analysis and the associated code with each method.
- RF-BigDataCS: A cost-sensitive approach for Random Forest to deal with Imbalanced Big Data using MapReduce
Inspired by the Mahout Random Forest Partial implementation we build a new Random Forest version that can be used to classify imbalanced big data. The Mahout Partial implementation (RF-BigData) is an algorithm that builds multiple trees for different portions of the data. This algorithm is divided into two different phases: the first phase is devoted to the creation of the model and the second phase is dedicated to the estimation of the classes associated with the dataset using the previous learned model. In the first phase, the Random Forest is built from the original training set following a MapReduce procedure. This process is illustrated in Figure 4 and consists of three steps: Initial, Map and Final. When the building of the forest is finished, the classification phase is initiated to estimate the class associated to a data sample set. This process is illustrated in Figure 5 and consists of three steps: Initial, Map and Final.
To adapt the cost-sensitive learning based version of Random Forest to the Mahout environment, we need to include the cost-sensitive operations into the basic Random Forest implementation.
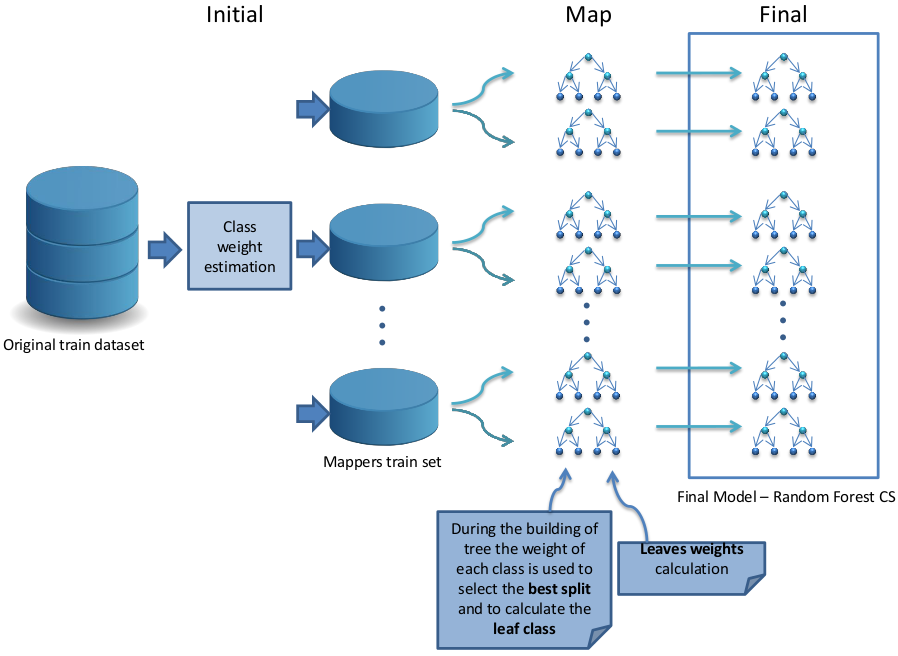
Figure 4: A flowchart of how the building of the Random Forest is organized in the RF-BigDataCS algorithm.
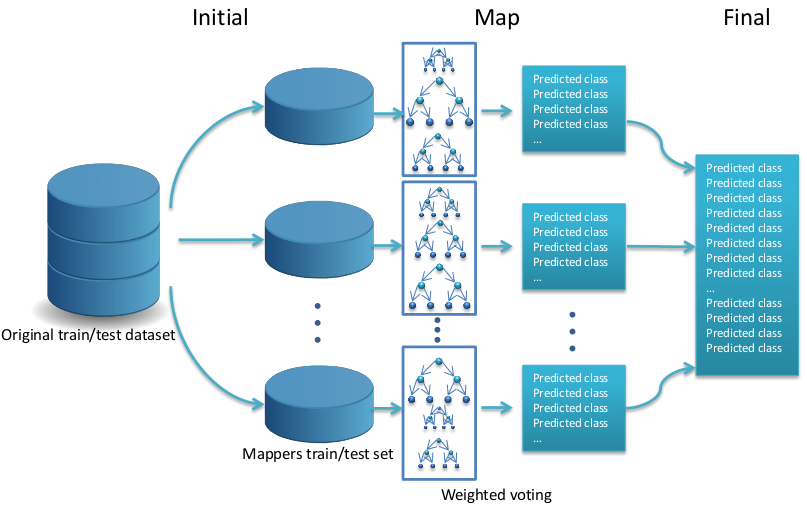
Figure 5: A flowchart of how the classifying step is organized in the RF-BigDataCS algorithm.
The source code is available in GitHub.
![]()

- Random oversampling for big data: An approximation with MapReduce
The Random Oversampling (ROS) algorithm has been adapted to deal with big data following a MapReduce design where each Map process is responsible for adjusting the class distribution in a mapper’s partition through the random replication of minority class instances and the Reduce process is responsible for collecting the outputs generated by each mapper to form the balanced dataset. This process is illustrated in Figure 6 and consists of four steps: Initial, Map, Reduce and Final.
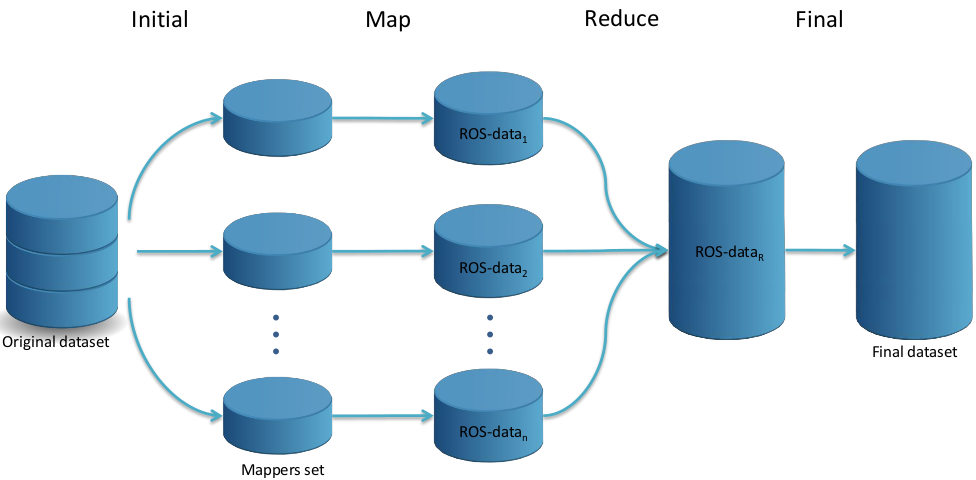
Figure 6: A flowchart of how the ROS MapReduce design works.
The source code is available in GitHub.
![]()

- Random undersampling for big data: Selecting samples following a MapReduce procedure
The Random Undersampling (RUS) version adapted to deal with big data follows a MapReduce design where each Map process is responsible for grouping by classes all the instances in its data partition and the Reduce process is responsible for collecting the output by each mapper and equilibrating the class distribution through the random elimination of majority class instances to form the balanced dataset. This process is illustrated in Figure 7 and consists of four steps: Initial, Map, Reduce and Final.
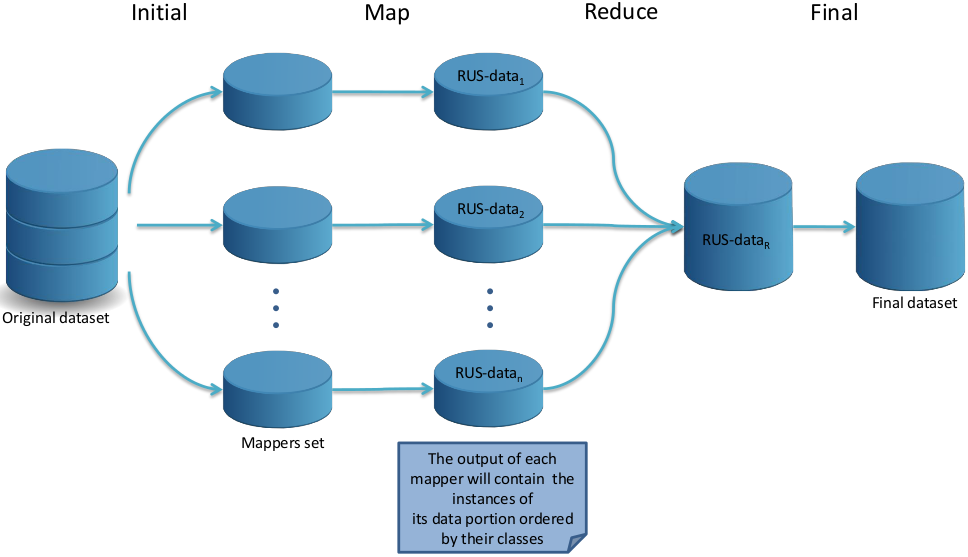
Figure 7: A flowchart of how the RUS MapReduce design works.
The source code is available in GitHub.
![]()
- SMOTE for big data: Adapting the generation of synthetic minority samples using MapReduce
The SMOTE algorithm has been adapted to deal with big data following a MapReduce design where each Map process oversamples the minority class and the Reduce process randomizes the output generated by each mapper to form the balanced dataset. This process is illustrated in Figure 8 and consists of four steps: Initial, Map, Reduce and Final.
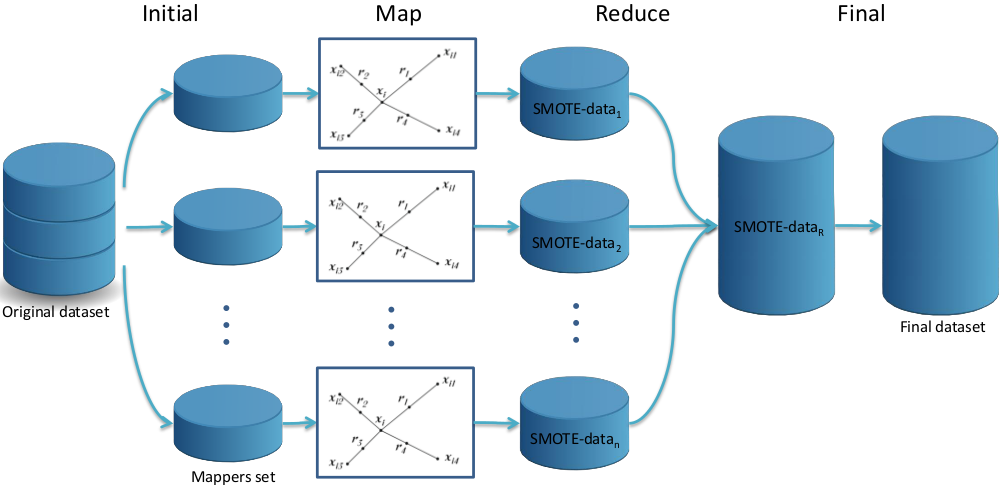
Figure 8: A flowchart of how the SMOTE MapReduce design works.
The source code is available in GitHub.
![]()
Finally, we include several experimental results for the former studies. These can be accessed by clicking on each excel logo.
- Average results for the MapReduce RF versions using 8, 16, 32 and 64 mappers on the imbalanced big data cases based on the kddcup dataset

- Average results for the MapReduce RF versions using 8, 16, 32 and 64 mappers on the RLCP dataset
- Average results for the MapReduce RF versions using 8, 16, 32 and 64 mappers on the imbalanced big data cases based on the poker dataset
Analysis of the oversampling rate for extremely imbalanced big data
In imbalanced classification problems the lack of density of the minority class causes a negative impact in the performance. In big data, the impact is further increased when the original data are partitioned into subsets by the MapReduce procedure.
For this reason, we analyze a hypothesis to deal with extremely imbalanced big data problems increasing the presence of the underrepresented class. Our hypothesis stated that an increment in the density of the underrepresented class by using higher oversampling ratios could improve the classification performance.
In order to evaluate the performance of our solution, we used the extremely imbalanced big data problem used in the ECBDL’14 Big Data Competition with nearly 32 million examples and 631 features. We use the MapReduce versions of the random oversampling (ROS) and the random undersampling (RUS) techniques (S. Río, V. López, J.M. Benítez, F. Herrera. On the use of MapReduce for Imbalanced Big Data using Random Forest. Information Sciences 285 (2014) 112-137) in order to balance the highly imbalanced class distribution of the dataset. Furthermore, due to the large number of features that this dataset has, we also apply the MapReduce approach for evolutionary feature weighting (I. Triguero, S. Río, V. López, J. Bacardit, J.M. Benítez, F. Herrera. ROSEFW-RF: The winner algorithm for the ECBDL'14 Big Data Competition: An extremely imbalanced big data bioinformatics problem. Knowledge-Based Systems 87 (2015) 69-79) with the aim of detect the most significant features. We use as base classifier a MapReduce implementation of the Random Forest algorithm (RF-BigData).
In order to bias the RF-BigData classifier towards the minority class, we consider to increase the density of this class. We increment the oversampling ratio in small steps from 105% to 180%. The following figure shows the procedure that we have carried out:
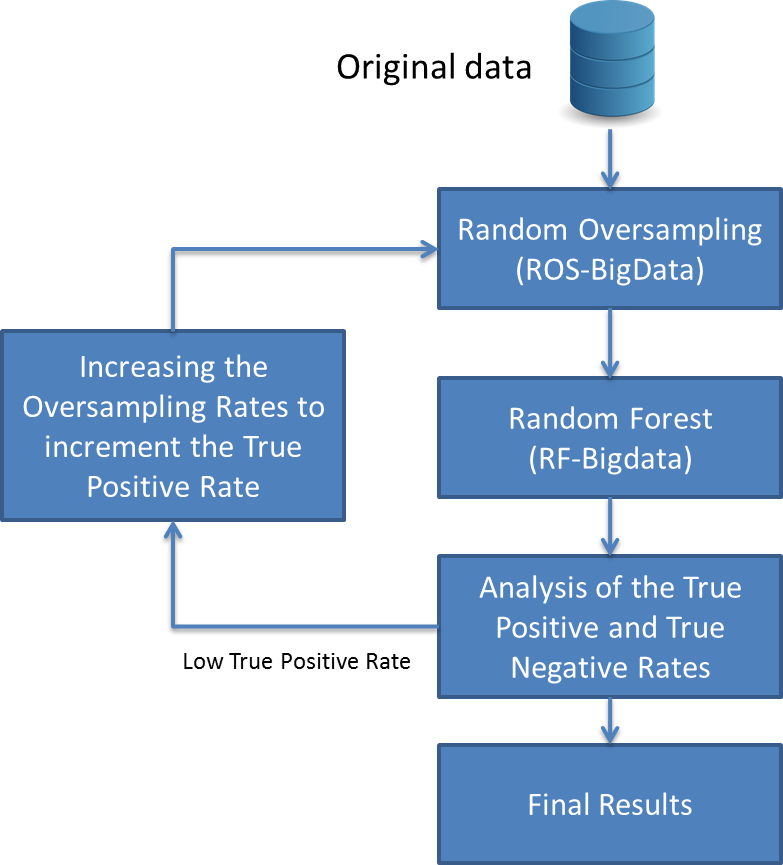
Flowchart illustrating the process to increase the True Positive Rate
The experiments carried out over the ECBDL’14 Big Data Competition dataset support this hypothesis and have yielded an improvement in the overall accuracy. Setting the oversampling ratio to a value that balances the True Positive Rate and the True Negative Rate values leads to the best performance in terms of accuracy.
This work has been published in the following reference:
- S. Río, J.M. Benítez, F. Herrera. "Analysis of Data Preprocessing Increasing the Oversampling Ratio for Extremely Imbalanced Big Data Classification", The 9th IEEE International Conference on Big Data Science and Engineering (IEEE BigDataSE-15), Volume 2; Helsinki (Finland), 180-185, August 20-22, 2015, doi: 10.1109/Trustcom.2015.579.
Evolutionary Undersampling for Imbalanced Big Data Classification
We have developed a parallel model to enable evolutionary undersampling methods to deal with large-scale problems. To do this, we design a MapReduce scheme that distributes the operation of these kinds of algorithms in a cluster of computing elements.
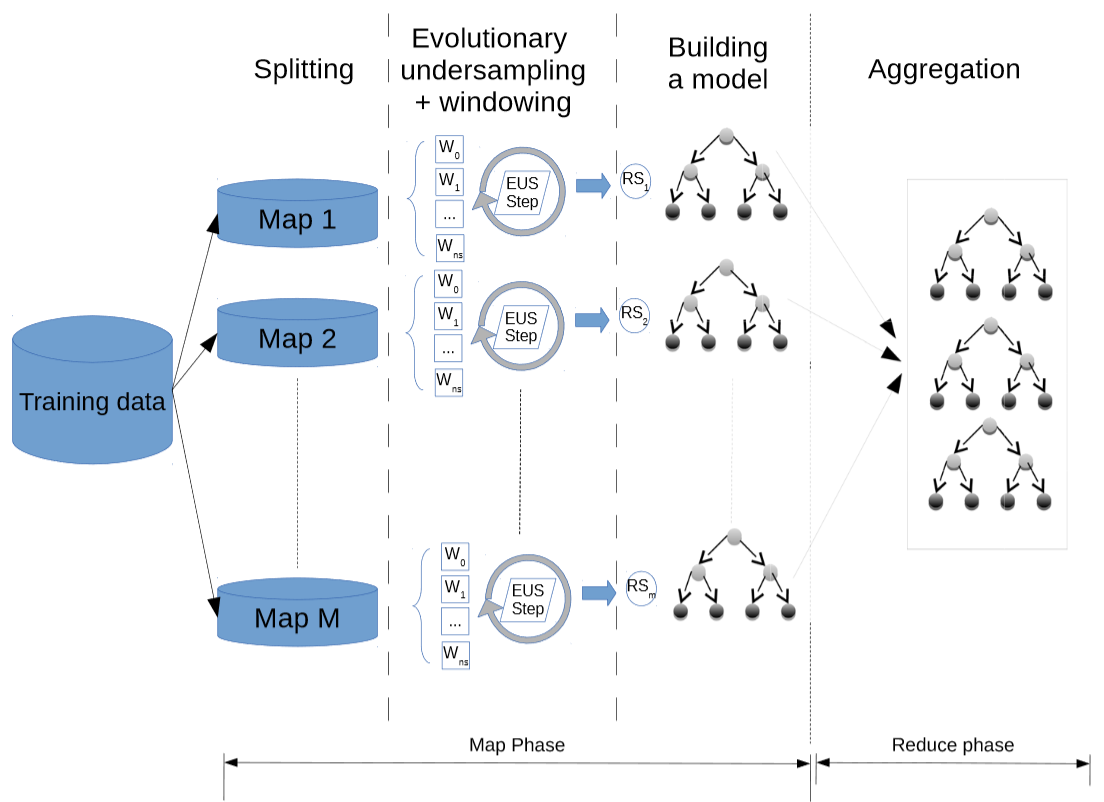
Flowchart of the learning phase of EUS-based decision tree classifier ensemble.
Moreover, we develop a windowing approach for class imbalance data without losing accuracy in order to speed up the undersampling process. The results show promising scalability abilities for evolutionary undersampling within the proposed framework.
The source code is available on GitHub:
![]()

I. Triguero, M. Galar, S. Vluymans, C. Cornelis, H. Bustince, F. Herrera, Y. Saeys. Evolutionary Undersampling for Imbalanced Big Data Classification. IEEE Congress on Evolutionary Computation (CEC 2015), Sendai (Japan), 715-722, May 25-28, 2015. ![]()
 Big Data classification with fuzzy models
1. Introduction to FRBCS
2. The Chi-FRBCS-BigData algorithm: A MapReduce Design based on the Fusion of Fuzzy Rules
3. The Chi-FRBCS-BigDataCS algorithm for imbalanced bigdata with cost sensitive: A MapReduce design
4. Fuzzy Rule Based Classification Systems for Big Data with MapReduce: Granularity Analysis
5. A View on Fuzzy Systems for Big Data: Progress and Opportunities
Introduction to FRBCS
Fuzzy Rule Based Classification Systems (FRBCSs) (H. Ishibuchi, T. Nakashima, M. Nii, Classification and Modeling with Linguistic Information Granules: Advanced Approaches to Linguistic Data Mining, Springer-Verlag, 2004) are effective and accepted tools for pattern recognition and classification. They are able to obtain a good precision while supplying an interpretable model for the end user through the usage of linguistic labels. Furthermore, the FRBCSs can manage uncertainty, ambiguity or vagueness in a very effective way. This trait is especially interesting when dealing with big data, as uncertainty is inherent to this situation. However, when dealing with big data, the information at disposal usually contains a high number of instances and/or features. In this scenario the inductive learning capacity of FRBCSs is affected by the exponential growth of the search space. This growth complicates the learning process and it can lead to scalability problems or complexity problems generating a rule set that is not interpretable (Y. Jin, Fuzzy modeling of high-dimensional systems: complexity reduction and interpretability improvement, IEEE Trans. Fuzzy Syst. 8 (2) (2000) 212-221).
To over come this situation there have been several approaches that aim to build parallel fuzzy systems (T.-P. Hong, Y.-C. Lee, M.-T. Wu, An effective parallel approach for genetic-fuzzy data mining, Expert Syst. Appl. 41 (2) (2014) 655-662). These approaches can distribute the creation of the rule base (M. Rodríguez, D. Escalante, A. Peregrín, Efficient distributed genetic algorithm for rule extraction, Appl. Soft Comput. 11 (1) (2011) 733-743) or the post-processing of the built model, using a parallelization to perform a rule selection (Y. Nojima, H. Ishibuchi, I. Kuwajima, Parallel distributed genetic fuzzy rule selection, Soft Comput. 13 (5) (2009) 511-519) or a lateral tuning of the fuzzy labels (I. Robles, R. Alcalá, J. Benítez, F. Herrera, Evolutionary parallel and gradually distributed lateral tuning of fuzzy rule-based systems, Evol. Intel. 2 (1–2) (2009) 5-19). Moreover, a fuzzy learning model can be completely redesigned to obtain a parallel approach that decreases the computation time needed (H. Ishibuchi, S. Mihara, Y. Nojima, Parallel distributed hybrid fuzzy GBML models with rule set migration and training data rotation, IEEE Trans. Fuzzy Syst. 21(2) (2013) 355-368). However, these models aim to reduce the wait for a final classification without damaging the performance and are not designed to handle huge volumes of data. In this manner, it is necessary to redesign the FRBCSs accordingly to be able to provide an accurate classification in a small lapse of time from big data.
The Chi-FRBCS-BigData algorithm: A MapReduce Design based on the Fusion of Fuzzy Rules
We have developed an FRBCS that can deal with big data classification problems providing an interpretable model and competitive accuracy results. Our implementation, denoted as Chi-FRBCS-BigData, is based on the Chi et al.'s approach (Z. Chi, H. Yan and T. Pham, Fuzzy algorithms with applications to image processing and pattern recognition, World Scientific, (1996)), a classical FRBCS learning method which has been adapted to deal with big data following a MapReduce scheme.
The fusion of linguistic fuzzy rules is a fundamental task in the approach due to the nature of the MapReduce procedure, which divides the original dataset into blocks. The Chi-FRBCS-BigData algorithm can generate contradictory rules (rules with the same antecedent, with or without the same consequent and with different rule weights), so it is necessary to address how the fusion of rules is performed with specific procedures. To do this, two different versions of Chi-FRBCS-BigData approach have been developed: Chi-FRBCS-BigData-Max and Chi-FRBCS-BigData-Ave. While both versions share most of their operations, they differ in the reduce step of the approach, where the generated rule bases are combined. Therefore, these variants of Chi-FRBCS-BigData algorithm obtain different final rule bases.
The Chi-FRBCSBigData algorithm uses two different MapReduce processes. One MapReduce process is devoted to the building of the model from a big data training set (Figure 9). The other MapReduce process is used to estimate the class of the examples belonging to big data sample sets using the previous learned model (Figure 10). Both parts follow the MapReduce design, distributing all the computations along several processing units that manage different chunks of information, aggregating the results obtained in an appropriate manner. The two versions developed, which we have named Chi-FRBCS-BigData-Max and Chi-FRBCSBigData-Ave share most of their operations, however, they behave differently in the reduce step of the approach, when the different RBs generated by each map are fused. These versions obtain different RBs and thus, different KBs.
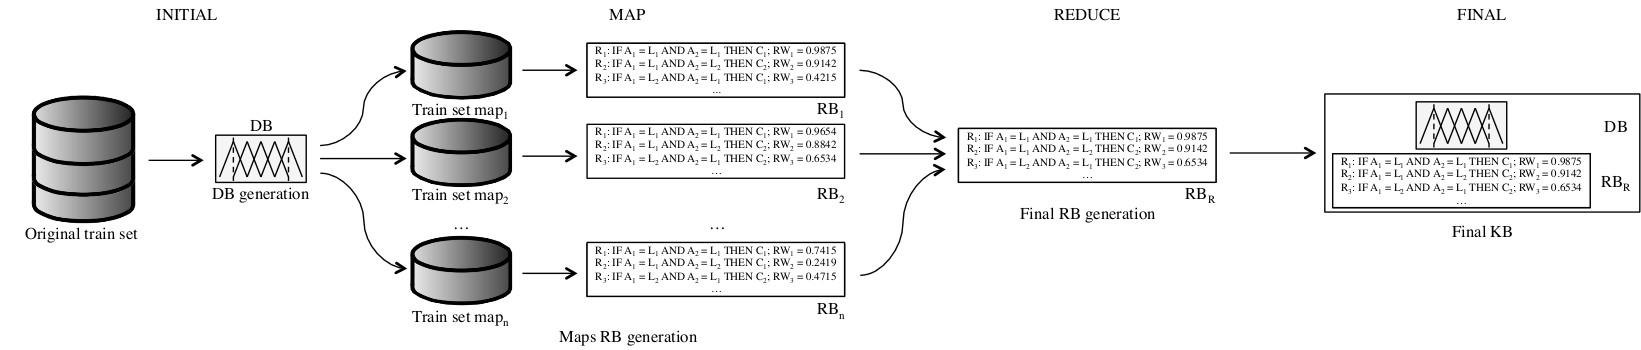
Figure 9: A flowchart of how the building of the KB is organized in Chi-FRBCS-BigData
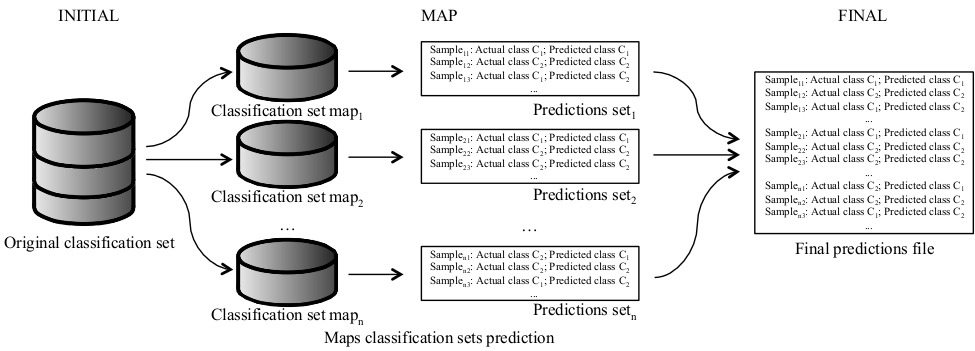
Figure 10: flowchart of how the classification of a big dataset is organized in Chi-FRBCS-BigData
The source codes for both Chi-FRBCS-BigData-Max and Chi-FRBCS-BigData-Ave are available in GitHub.
![]()

![]()

S. Río, V. López, J.M. Benítez, F. Herrera. A MapReduce Approach to Address Big Data Classification Problems Based on the Fusion of Linguistic Fuzzy Rules. International Journal of Computational Intelligence Systems 8:3 (2015) 422-437. doi: 10.1080/18756891.2015.1017377 ![]()
The Chi-FRBCS algorithm for imbalanced bigdata: A MapReduce design
We have implemented a FRBCS that is capable of classifying imbalanced big data which has been denoted as Chi-FRBCS-BigDataCS. The method is based on the Chi et al.’s approach (Z. Chi, H. Yan, T. Pham, Fuzzy Algorithms with Applications to Image Processing and Pattern Recognition, World Scientific,1996), a classical FRBCS learning method, which has been modified to deal with imbalanced datasets and big data at the same time.
Specifically, the Chi-FRBCS-BigDataCS algorithm is a MapReduce design where each map process is responsible for building a Rule Base using only the data included in its portion and where the reduce process is responsible for collecting and combining the Rule Base generated by each mapper to form the final Rule Base. This algorithm is divided into two different phases: the first phase is devoted to the creation of the model, Figure 11, and the second part is devoted to the estimation the class associated to a dataset. Both phases follow the MapReduce structure distributing all the computations needed along several processing units that manage different chunks of information, aggregating the results obtained in an appropriate manner.
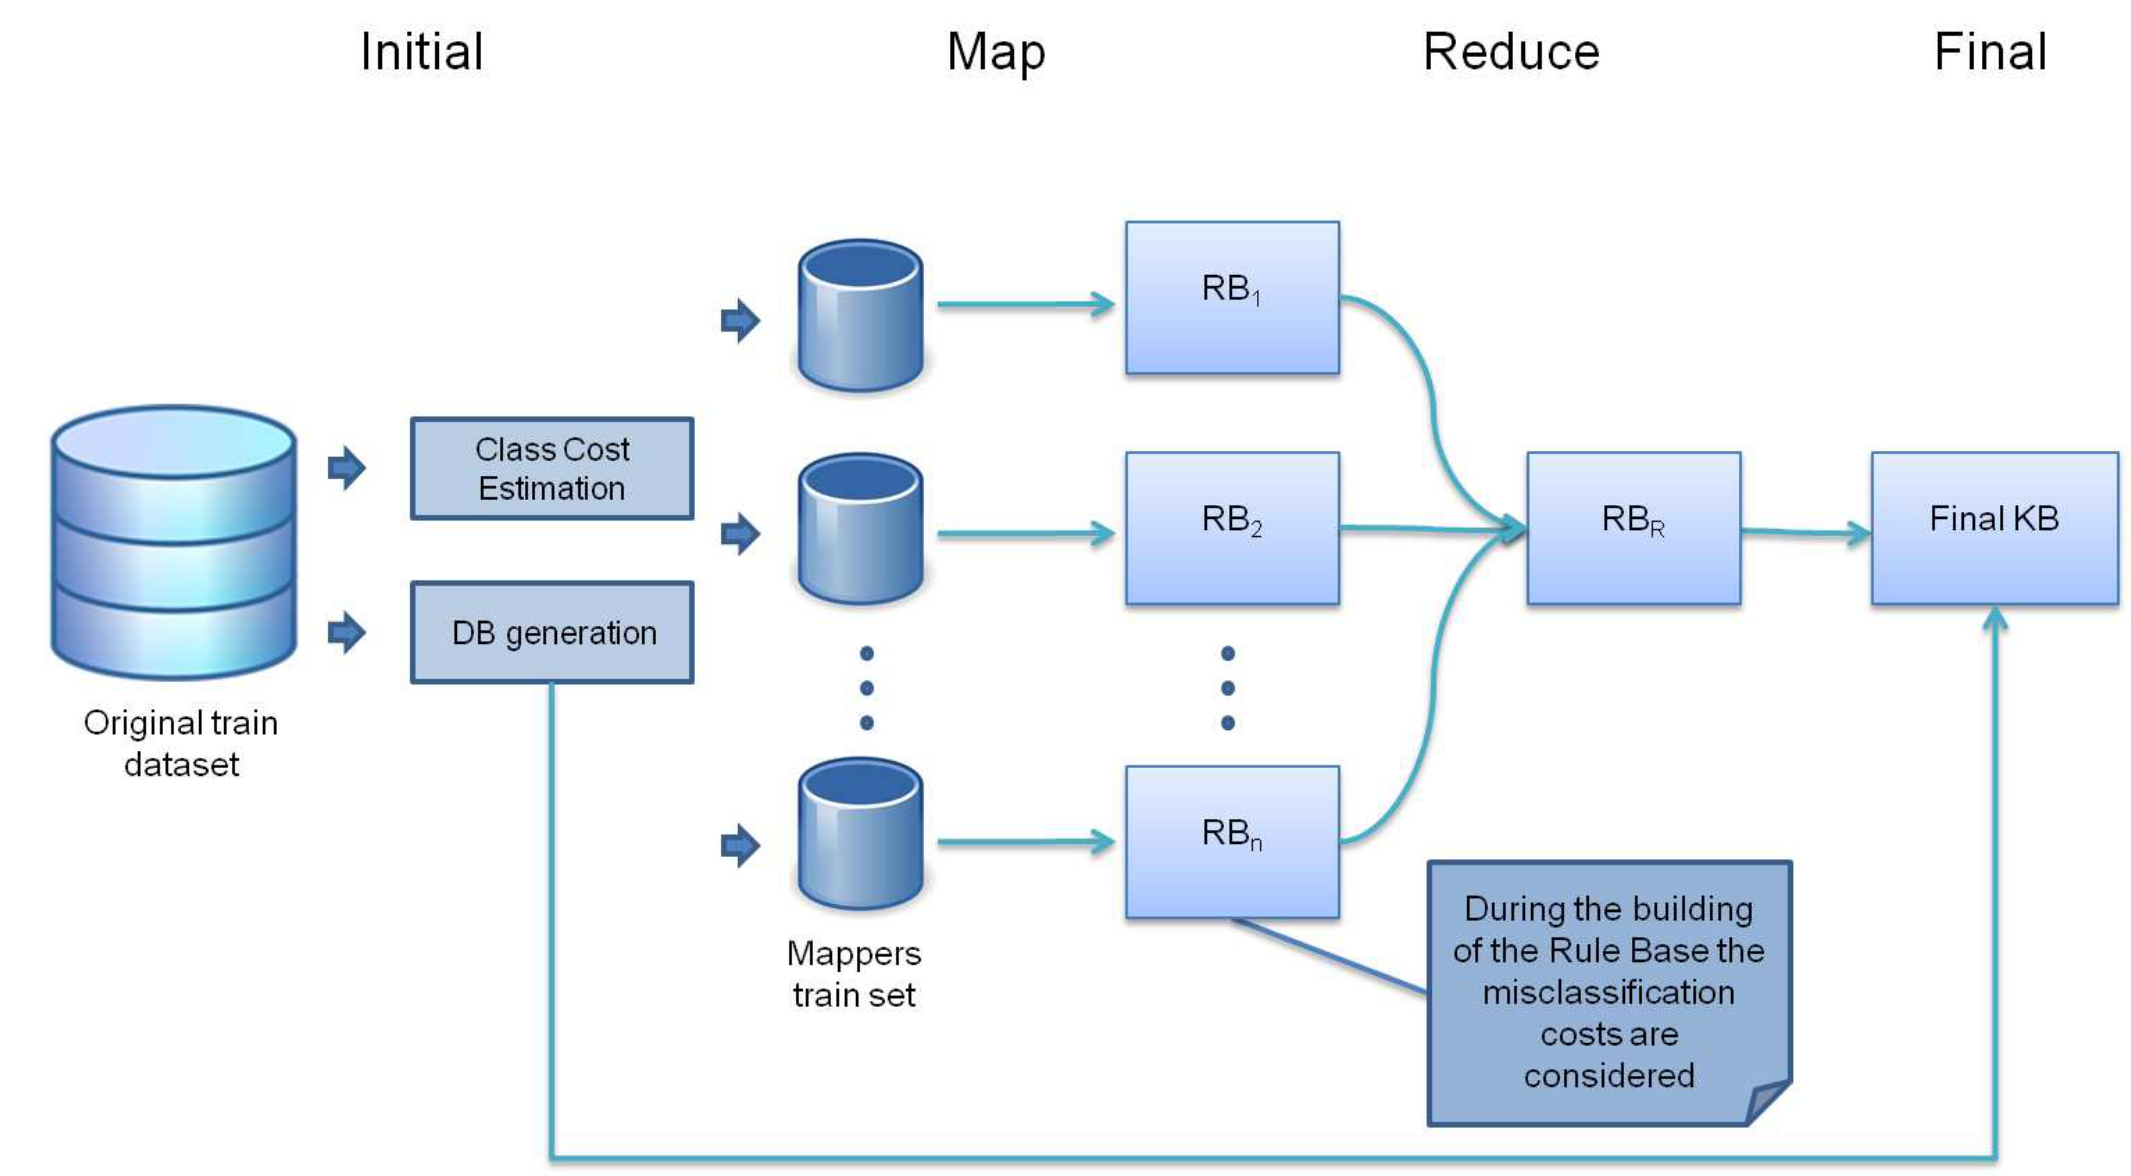
Figure 11: A flowchart of how the building of the KB is organized in Chi-FRBCS-BigDataCS.
The source code is available in GitHub.
![]()

V. López, S. Río, J.M. Benítez, F. Herrera. Cost-Sensitive Linguistic Fuzzy Rule Based Classification Systems under the MapReduce Framework for Imbalanced Big Data. Fuzzy Sets and Systems 258 (2015) 5-38. http://dx.doi.org/10.1016/j.fss.2014.01.015 ![]()
Fuzzy Rule Based Classification Systems for Big Data with MapReduce: Granularity Analysis
It is well known that the number of fuzzy labels for building the DB is a significant parameter to achieve a precise description of the problem space, i.e. can be viewed as a sort of context information. Therefore, depending on the problem structure and the data scattering, a higher or lower number of linguistic terms will be needed in order to provide a good discrimination ability. Particularly, if the classes are highly overlapping, the level of granularity to allow a good discrimination of the examples gets higher. Therefore, the data distribution is one of the main characteristics to determine the most appropriate value of the granularity, as it has a significant influence on the FRBCS performance.
When we obtain the KB within a MapReduce approach, we must be aware that the number of maps selected for this process imply a very different distribution of the data. Hence, as more efficiency is demanded, so it does the scattering of the original data among the map functions.
Regarding this fact, we can assume that the differences in performance for any classification problem regarding the number of Maps selected, will become less significant as the number of labels increases. This is due to several facts. On the one hand, the capabilities of fuzzy learning algorithms make them less sensible to the "lack of data." On the other hand, a higher granularity allows the construction of a robust model, in accordance to the more detailed representation of the space of the problem.
In this context, we carry out the following research:
- First, to study the dependency of the granularity level, i.e. number of fuzzy labels per variable, and the number of selected Maps for the FRBCS in Big Data problems. In order to do so, we have selected the Chi-FRBCS-BigData algorithm in an experimental framework with datasets of different characteristics (especially in terms of number of examples).
- Additionally, our experimental results determine the benefit of a higher granularity in this context for all case studies. This is due to the use of better local representation of the generated subproblems in addition to the final fusion of rules.
- Finally, we show that FRBCSs are robust in terms of the data scattering, maintaining a good performance even when increasing the number of Maps used. In this way, this type of systems has the advantage of their scalability.
A. Fernandez, S. Río, F. Herrera. Fuzzy Rule Based Classification Systems for Big Data with MapReduce: Granularity Analysis. Advances in Data Analysis and Classification, in press. doi: 10.1007/s11634-016-0260-z. ![]()
A View on Fuzzy Systems for Big Data: Progress and Opportunities
It is well known that a fuzzy representation for the modeling of solutions, allows a simplicity and flexibility which makes them suitable for addressing complex problems. This can be achieved as they are able to cope with vague, imprecise or uncertain concepts that human beings use in their usual reasoning, as well as their interpretability based on the linguistic variables.
In the context of Big Data problems, the former properties make them a valuable tool for developing robust solutions, handling the variety and veracity inherent to the available data. Additionally, the use of fuzzy labels and their overlapping, allows a good coverage of the problem space. This last fact is especially significant for the MapReduce processing scheme. Specifically, we are referring to the case when the division of the original data into different chunks may cause a bias for the presence of small disjuncts, i.e. those disjuncts in the learned classifier that cover few training examples.
Taking the former into account, we provided an analysis of fuzzy modeling for different tasks in Big Data problems, i.e. classification, clustering, subgroup discovery, and so on. Being a novel area of research, there were still few works on the topic. Therefore, we considered to be of high importance to understand the nature of Big Data and how this problem is currently addressed. In this sense, some criteria for the correct development of solutions under the umbrella of fuzzy sets must be established. This way, we can achieve the highest advantage in extending current approaches. In summary, we aimed at defining the direction for the design of powerful algorithms based on fuzzy systems, and how the information extracted with these models can be useful for the experts.
Particularly, we presented the current features related to fuzzy approaches in the scenario of Big Data into three different blocks:
- What has been done. First, we presented those methodologies that have been already developed in this area of research.
- How it can be designed. Next, we introduced several guidelines for the implementation of fuzzy models into a MapReduce framework.
- Associated problems of the MapReduce paradigm for classification. Finally, we pointed out some problems associated to the MapReduce execution style, and how the properties of fuzzy systems make them well suited to overcome them.
To conclude our study, we carried out a discussion for fuzzy modeling in a Big Data scenario. Specifically, we considered that new research in the Big Data scenario for fuzzy modeling must be focused on re-designing the state-of-the-art algorithms, as well as novel approaches for recent work scenarios. By doing so, a complete library of methods would be available for researchers and experts to take the full advantage of this novel work area. Additionally, this can be used as basis for the development of novel and more powerful fuzzy algorithms. However, the transition from standard learning approaches towards the MapReduce parallel model is not straightforward, and requires a thorough analysis of the designer.
In order to do so, we must focus our attention on a careful definition of the mechanisms of information combination. In this sense, the "Reduce" phase must be analyzed in detail. We must take into account the handicap of the division in the computation for different Maps, and to study the dependency of the models that have been learned in each one of the former. Determining an optimal combination of these models is a fundamental decision when applying a MapReduce scheme in Big Data Analytics. A smart combination of the systems learned within each Map must be carried out seeking for a good synergy, thus avoiding the local bias from the subsets they were learned with.
Finally, there are plenty of new and complex paradigms that are growing in importance in the last years that must be also taken into account. We may refer to multi-instance learning, multi-label, monotonic classification, semi-supervised learning, multi-view learning, social mining, and opinion mining, to enumerate the most relevant ones. Another source of research is the management of data streams, where the time constraints and the need for an adaptive learning approach, imply a higher degree of difficulty.
A. Fernandez, C.J. Carmona, M.J. del Jesus, F. Herrera. A View on Fuzzy Systems for Big Data: Progress and Opportunities. International Journal of Computational Intelligence Systems, 9:1 (2016), 69-80 doi: 10.1080/18756891.2016.1180820. ![]()
Classification Algorithms: k-NN
The k-Nearest Neighbor classifier is one of the most well-known methods in data mining because of its effectiveness and simplicity. However, It lacks the scalability to manage big datasets. The main problems found for dealing with large-scale data are runtime and memory consumption.
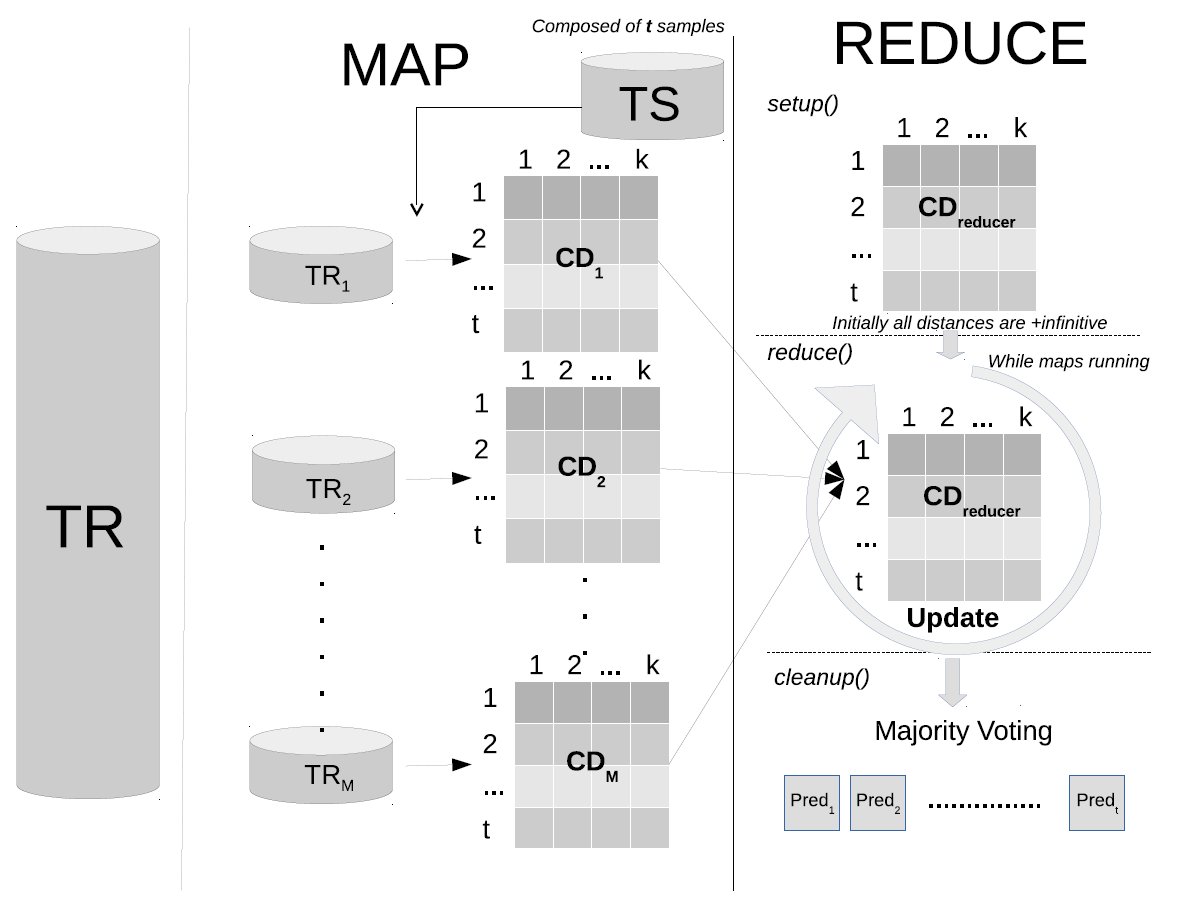
Flowchart of the proposed MR-kNN algorithm.
The source code is available on GitHub.![]()

The two approaches are developed under MapReduce paradigm. MR-kNN is our approach developed in Apache Hadoop. This model allows us to classify large amounts of test examples against a big training dataset. The map phase computes the k-nearest neighbors in different splits of the training data. Afterward, the reduce stage will compute the definitive neighbors from the list obtained in the map phase. Moreover, this parallel implementation provides the exact classification rate as the original k-NN model. The experiments show the promising scalability capabilities of the proposed approach.
J. Maillo, I. Triguero, F. Herrera. A MapReduce-based k-Nearest Neighbor Approach for Big Data Classification. 9th International Conference on Big Data Science and Engineering (IEEE BigDataSE-15), Volume 2; Helsinki (Finland), 167-172, August 20-22, 2015. doi: 10.1109/Trustcom.2015.577 ![]()
Motivated with the results of MR-kNN, we design and develop another proposal. This is implemented in Apache Spark, using their primitive instructions in order to work with main memory and do even more scalable by iterating over the test set , if it is needed.
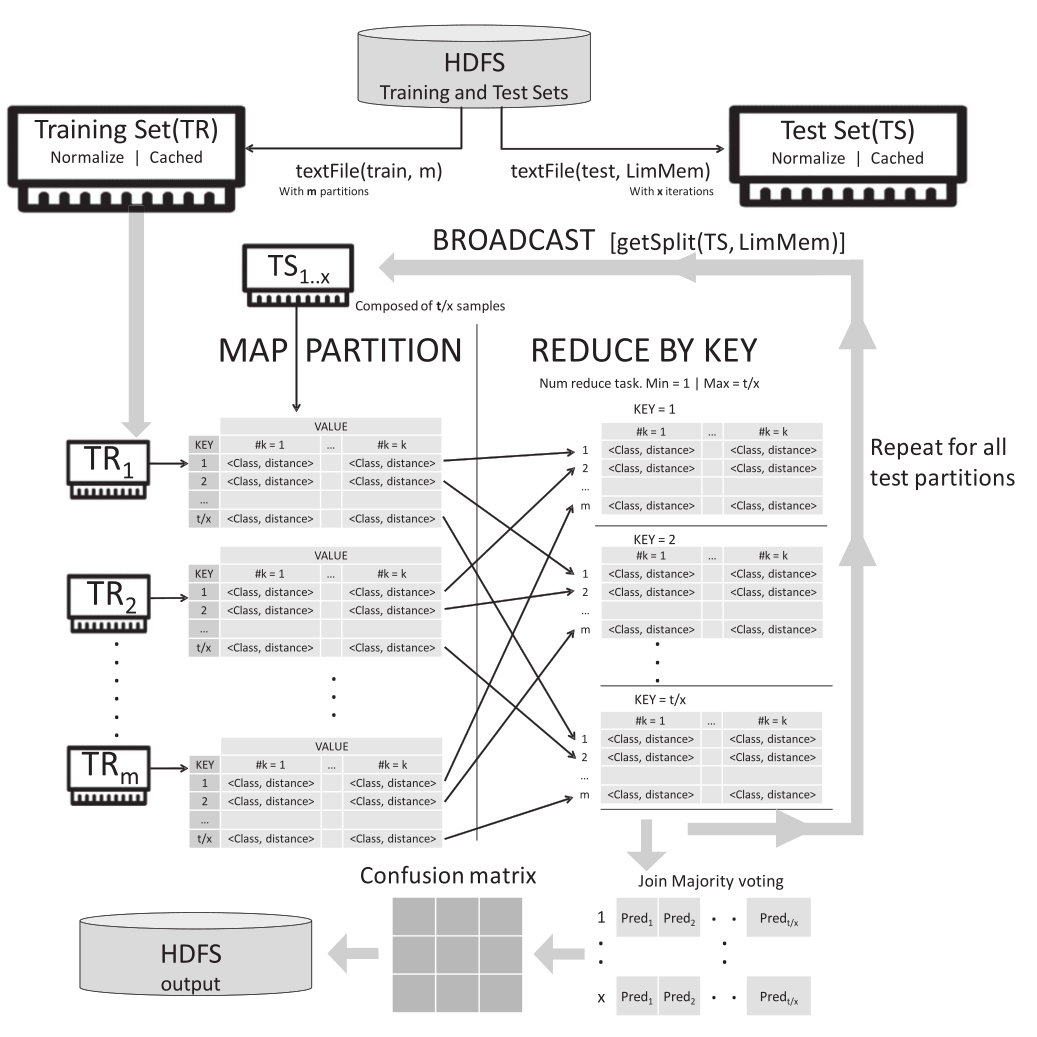
Flowchart of the proposed kNN-IS algorithm.
This flowchart shows the iterative process of our Iterative approach. For each iteration, the map phase computes the k nearest neighbors of a split of the test set against the complete training set. The reduce phase combines the candidates neighbors and It selects the final k nearest neighbors of these.
The source code is available on GitHub.![]()

Also, It is available as a software on Spark package.
kNN-IS is more efficient than MR-kNN and It is available in spark-package and GitHub with two different data structure. The MLlib version runs over RDD structures. The ML version runs over DataFrame.
J. Maillo, S. Ramírez-Gallego, I. Triguero, F. Herrera. kNN-IS: An Iterative Spark-based design of the k-Nearest Neighbors classifier for big data. Knowledge-Based Systems, in press doi: 10.1016/j.knosys.2016.06.012 ![]()
 Big Data Applications
In this section we present the list of large-scale problems tackled by our distributed algorithms. Likewise, the associated works to these problems are listed below:
1. Contact Map Prediction (Protein structure prediction)
2. Ortholog Detection in Related Yeast Species
Contact Map Prediction (Protein structure prediction)
Contact Map (CM) prediction is a bioinformatics (and specifically a protein structure prediction) classification task that is an ideal test case for a big data challenge for several reasons. CM data sets easily reach tens of millions of instances, hundreds (if not thousands) of attributes and
have an extremely high class imbalance. In this work we describe step-by-step the methodology with which we have participated, under the name ’Efdamis’, in the ECBDL’14 competition (described in the Dataset Repository Section), ranking as the winner algorithm. Figure 12 summarizes the procedure we followed in the competition:
Figure 12: Flowchart of the procedure followed during the competition.
This work has been published in the following reference:
I. Triguero, S. Río, V. López, J. Bacardit, J.M. Benítez, F. Herrera. ROSEFW-RF: The winner algorithm for the ECBDL'14 Big Data Competition: An extremely imbalanced big data bioinformatics problem. Knowledge-Based Systems 87 (2015) 69-79. doi: 10.1016/j.knosys.2015.05.027 ![]()
Ortholog Detection in Related Yeast Species
In this paper, a set of gene pair features based on similarity measures, such as alignment scores, sequence length, gene membership to conserved regions, and physicochemical profiles, are combined in a supervised pairwise ortholog detection (POD) approach to improve effectiveness considering low ortholog ratios in relation to the possible pairwise comparison between two genomes. In this POD scenario, big data supervised classifiers managing imbalance between ortholog and non-ortholog pair classes allow for an effective scaling solution built from two genomes and extended to other genome pairs.
This work has been published in the following reference:
D. Galpert, S. Río, F. Herrera, E. Ancede-Gallardo, A. Antunes, G. Agüero-Chapin. An Effective Big Data Supervised Imbalanced Classification Approach for Ortholog Detection in Related Yeast Species. BioMed Research International, vol. 2015, Article ID 748681, 12 pages, 2015. doi: 10.1155/2015/748681 ![]()
 Dataset repository
In this section we provide a collection of different datasets and problems that can be used for classification tasks with Big Data. Currently, it is divided into four different parts: (1) datasets taken for the well-known UCI Machine Learning Repository; (2) datasets selected from the LibSVM repository; (3) a link to Pascal large scale repository; and (4) individual problems.
- UCI Machine Learning Repository: https://archive.ics.uci.edu/ml/datasets.html
- HIGGS: This is a classification problem to distinguish between a signal process which produces Higgs bosons and a background process which does not. The dataset has 11,000,000 instances, 28 attributes and 2 classes. Source: https://archive.ics.uci.edu/ml/datasets/HIGGS
- Record Linkage Comparison Patterns: Source: Element-wise comparison of records with personal data from a record linkage setting. The task is to decide from a comparison pattern whether the underlying records belong to one person. The dataset has 5,749,132 instances, 12 attributes and 2 classes. Source: https://archive.ics.uci.edu/ml/datasets/Record+Linkage+Comparison+Patterns
- SUSY: This is a classification problem to distinguish between a signal process which produces supersymmetric particles and a background process which does not. The dataset has 5,000,000 instances, 18 attributes and 2 classes. Source: https://archive.ics.uci.edu/ml/datasets/SUSY
- KDD Cup 1999: This is the data set used for The Third International Knowledge Discovery and Data Mining Tools Competition, which was held in conjunction with KDD-99 The Fifth International Conference on Knowledge Discovery and Data Mining. The competition task was to build a network intrusion detector, a predictive model capable of distinguishing between "bad" connections, called intrusions or attacks, and "good" normal connections. This database contains a standard set of data to be audited, which includes a wide variety of intrusions simulated in a military network environment. The dataset has 4,000,000 instances, 42 attributes and 22 classes. Source: https://archive.ics.uci.edu/ml/datasets/KDD+Cup+1999+Data
- Poker Hand: Purpose is to predict poker hands. The dataset has 1,025,010 instances, 10 attributes and 10 classes. Source: https://archive.ics.uci.edu/ml/datasets/Poker+Hand
- Covertype: Forest CoverType dataset. The dataset has 581,012 instances, 54 attributes and 7 classes. Source: https://archive.ics.uci.edu/ml/datasets/Covertype
- Census: This data set contains weighted census data extracted from the 1994 and 1995 current population surveys conducted by the U.S. Census Bureau. The dataset has 299,285 instances, 40 attributes and 2 classes. Source: https://archive.ics.uci.edu/ml/datasets/Census-Income+%28KDD%29
- LIBSVM Dataset Repository: http://www.csie.ntu.edu.tw/~cjlin/libsvmtools/datasets/
- epsilon: The raw data set (epsilon_train) is instance-wisely scaled to unit length and split into two parts: 4/5 for training and 1/5 for testing. The training part is feature-wisely normalizied to mean zero and variance one and then instance-wisely scaled to unit length. Using the scaling factors of the training part, the testing part is processed in a similar way. The dataset has 500,000 instances, 2000 attributes and 2 classes. Source: http://www.csie.ntu.edu.tw/~cjlin/libsvmtools/datasets/binary.html#epsilon
- Pascal Large Scale Learning Challenge Repository: ftp://largescale.ml.tu-berlin.de/largescale/
- Datasets recommended by Springboard: https://www.springboard.com/blog/free-public-data-sets-data-science-project/
- Individual datasets:
- ECBDL14: generated to train a predictor for the residue-residue contact prediction track of the CASP9 competiton. The dataset has 32 million instances, 631 attributes, 2 classes, 98% of negative examples and occupies, when uncompressed, about 56GB of disk space. Source: http://cruncher.ncl.ac.uk/bdcomp/
 Literature review: surveys and overviews
The field of Big Data has experienced a flourishing growth in the last decade. Many interesting works have been developed under this area; not only new approaches, but several survey papers, books and other research to address scalability in this scenario.
With this aim, in this section some recent overviews on the topic are collected. The list is devoted to be of high interest for the research community in Big Data. Please click on the "abstract link" in order to show/hide the abstract for each paper.
Surveys and overviews
- A. Fernandez, S. Río, V. López, A. Bawakid, M.J. del Jesus, J.M. Benítez, F. Herrera. Big Data with Cloud Computing: An Insight on the Computing Environment, MapReduce and Programming Frameworks. WIREs Data Mining and Knowledge Discovery 4(5): 380-409. doi: 10.1002/widm.1134 (2014)
- Marx, V. The Big Challenges of Big Data, NATURE 498(7453): 255-260, DOI: 10.1038/498255a (2013)
- Wu, XD; Zhu, XQ; Wu, GQ; Ding, W. Data Mining with Big Data. IEEE TRANSACTIONS ON KNOWLEDGE AND DATA ENGINEERING 26(1):97-107, DOI: 10.1109/TKDE.2013.109, (2014)
- Chen, CLP; Zhang, CY. Data-intensive applications, challenges, techniques and technologies: A survey on Big Data. INFORMATION SCIENCES 275:314-347 DOI: 10.1016/j.ins.2014.01.015, (2014)
- Zhai Y, Ong Y, Tsang IW The emerging “big dimensionality”. IEEE Comp Int Mag 9(3):14–26, DOI: 10.1109/MCI.2014.2326099, (2014)
- Chen, M; Mao, SW; Liu, YH. Big Data: A Survey. MOBILE NETWORKS & APPLICATIONS 19(2): 171-209, DOI: 10.1007/s11036-013-0489-0 (2014)
- O'Leary, DE. Artificial Intelligence and Big Data. IEEE INTELLIGENT SYSTEMS 28(2): 96-99, DOI: 10.1109/MIS.2013.39 (2013)
- Kraska, T Finding the Needle in the Big Data Systems Haystack. IEEE INTERNET COMPUTING 17(1):84-86, DOI: 10.1109/MIC.2013.10 (2013)
- Sakr, S; Liu, AN; Fayoumi, AG, The Family of MapReduce and Large-Scale Data Processing Systems. ACM COMPUTING SURVEYS 46(1):11, DOI: 10.1145/2522968.2522979 (2013)
- M. D. Assunção; R. N. Calheiros, S. Bianchi, M. A.S. Netto, R. Buyyab. Big Data computing and clouds: Trends and future directions. JOURNAL OF PARALLEL DISTRIBUTED COMPUTING, DOI: 10.1016/j.jpdc.2014.08.003 in press (2015)
- K. Kambatla, G. Kollias, V. Kumar, A. Grama. Trends in big data analytics. JOURNAL OF PARALLEL DISTRIBUTED COMPUTING, 74: 2561-2573, DOI: 10.1016/j.jpdc.2014.01.003 (2014)
- I. A. T. Hashem, I. Yaqoob, N. B. Anuar, S. Mokhtar, A. Gani, S.U. Khan. The rise of “big data” on cloud computing: Review and open research issues. INFORMATION SYSTEMS 47: 98-115, DOI: 10.1016/j.is.2014.07.006 (2015)
 Keynote Slides
F. Herrera, "Data Mining Methods for Big Data Preprocessing". Seminar at: INIT/AERFAI Summer School on Machine Learning, Benicàssim (Spain), June 22-26, 2015 ![]()
F. Herrera, "A tour on big data classification. Selected Computational Intelligence approaches". Plenary talk at: 16th IFSA World Congress & 9th EUSFLAT Conference, Gijón (Spain), June 30th - July 3rd, 2015 ![]()
 Links of interest
Several related Web pages are linked in order to complement the information shown in this thematic Website.
Readers may find official Websites from the MapReduce technologies stressed here, i.e. Hadoop and Spark, together with several alternatives for graph programming, data streams, and MapReduce implementations over GPUs. Additionally, other interesting links includes open courses, blogs with information on Big Data / Data Science, and many other related Webs on the topic.
- Apache Hadoop's main webpage: https://hadoop.apache.org
- Apache Spark's main webpage: https://spark.apache.org/
- Apache Spark's API: https://spark.apache.org/docs/latest/api/scala/index.html
- Mahout Machine Learning library: http://mahout.apache.org/
- Spark MLib: https://spark.apache.org/mllib/
- The Scala programming language: http://www.scala-lang.org/
- Apache Spark's packages: http://spark-packages.org/
- Rhipe (R+Hadoop): https://www.datadr.org/
- Vowpal Wabbit: https://github.com/JohnLangford/vowpal_wabbit/wiki
- Dryad (Directed Acyclic Graph model): http://research.microsoft.com/en-us/projects/dryad/
- Giraph (Bulk Synchronous Parallel model): http://giraph.apache.org/
- Storm (Distributed real-time computation system): http://hortonworks.com/hadoop/storm/
- S4 (Distributed Stream Computing Platform): http://incubator.apache.org/s4/
- Phoenix (MapReduce for shared-memory systems - GPU): https://github.com/kozyraki/phoenix
- Databricks' web page: http://databricks.com/
- Gartner Big Data: http://www.gartner.com/it-glossary/big-data
- Probabilistic Data Structures for Web Analytics and Data Mining: https://highlyscalable.wordpress.com/2012/05/01/probabilistic-structures-web-analytics-data-mining/
- Big Data/Analytics Zone (blog): http://www.dzone.com/mz/big-data
- Coursera (open courses for Big Data / Data Science): https://www.coursera.org/
- Edx (Open courses for Apache Spark): https://www.edx.org/course?search_query=apache+spark
- Large Open-Big Data: http://www.quora.com/Where-can-I-find-large-datasets-open-to-the-public
- Stack Overflow questions about Spark: http://stackoverflow.com/questions/tagged/apache-spark