Prototype Selection for Nearest Neighbor Classification: Taxonomy and Empirical Study - Complementary Material
This Website contains additional material to the SCI2S research paper on Prototype Selection
S. García, J. Derrac, J.R. Cano and F. Herrera, Prototype Selection for Nearest Neighbor Classification: Taxonomy and Empirical Study. IEEE Transactions on Pattern Analysis and Machine Intelligence 34:3 (2012) 417-435 doi: 10.1109/TPAMI.2011.142 ![]()
Summary:
Experimental study
Short description of the 3 studies performed
Three different experimental studies have been carried out in order to compare the performance of the different Protoype Selection methods analyzed in the review:
Standard data sets with missing values imputation
This study includes the original experiments carried out in the paper Sections 4.2 (Analysis and Empirical Results on Small Size Data Sets) and 4.3 (Analysis and Empirical Results on Medium Size Data Sets). The experiments in Section 4.2 analyze 42 different prototype selection methods over 39 small size data sets, whereas the experiments in Section 4.3 analyze 21 different prototype selection methods over 27 medium size data sets.
Some of the data sets (automobile, bands, breast, cleveland, crx, dermatology, hepatitis, housevotes, mammographic, marketing and wisconsin) includes missing values. In order to allow the prototype selection methods to work properly, in this experimental study a simple missing value imputation procedure has been built in the implementacion of the methods provided. This method substitutes each missing value by the attribute mean (attribute mode for nominal features), considering all the instances in the training set.
Standard data sets without missing values
This study includes new experiments performed without missing data. It features a comparison among 21 different prototype selection methods (the same that were selected for the original experiments in Section 4.3 of the paper) over 58 standard data sets (the 39 small size data sets of the original expriments in Section 4.2 plus the 21 medium size data sets of the original expriments in Section 4.3).
In this case, instances including missing values in some of the data sets (automobile, bands, breast, cleveland, crx, dermatology, hepatitis, housevotes, mammographic, marketing and wisconsin) have been removed before the partitioning process. Hence, no missing value imputation procedure has been employed throughout these experiments.
Large data sets and missing value imputation
This study includes the original experiments carried out in the paper Section 5 (Experimental Framework, Empirical Study and Analysis of Results: Large Data Sets). These experiments analyzes 7 different prototype selection methods and 2 approximate nearest neighbor classification techniques over 7 large size data sets.
Two data sets (adult and census) includes missing values. In order to allow the prototype selection methods to work properly, in this experimental study a simple missing value imputation procedure has been built in the implementacion of the methods provided. This method substitutes each missing value by the attribute mean (attribute mode for nominal features), considering all the instances in the training set.
Standard data sets with missing values imputation
Experimental setup
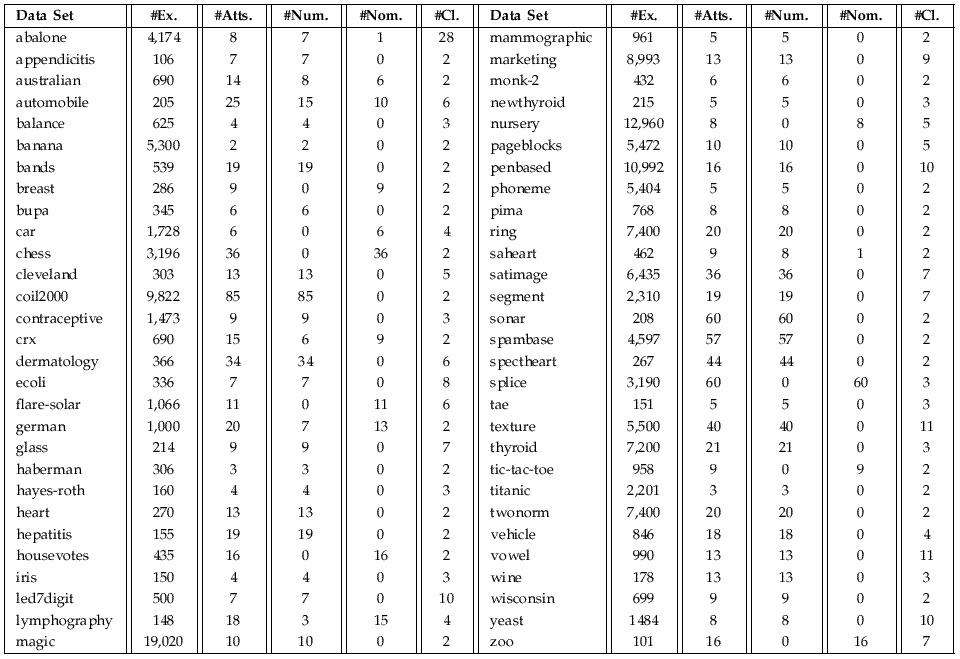
This section describes the experimental setup used for the comparison of the prototype selection methods over standard data sets with missing values imputation. Firstly, a table shows the prototype selection methods included and the parameters set to each one (note that this configuration is the same for each dataset). Then, a second table describes the characteristics of the data sets selected to test the methods.
Prototype selection methods and parameters
Below is shown a table with the prototype selection methods considered and the relevant parameters used in the the experimental study.
All methods use the Euclidean Distance, and k values of 1 and 3 are considered.
| AllKNN | - |
| CCIS | - |
| CHC | Population=50,#Eval=10000,α=0.5,%inRestart=0.35 |
| CNN | - |
| CoCoIS | Individuals=100, Subpopulations=5, Max Generations=100, M=10, N=10, W=0.9, Mutation=0.1, Subpopulation size=30, WError=0.25, WReduction=0.15, WDifference=0.6, Elitism=0.5, PRnn=0.1, PRandom=0.1, PBit=0.1 |
| CPruner | - |
| DROP3 | - |
| ENN | - |
| ENNTh | Noise Threshold = 0.7 |
| ENRBF | σ= 1,α= 1 |
| Explore | - |
| FCNN | - |
| GCNN | - |
| GGA | Cross= 0.6, Population=51,#Eval=10000,Alpha=0.5, Mutation=0.01 |
| HMNEI | ε= 0.1 |
| IB3 | Confidence Acceptance = 0.9, Confidence Dropping = 0.7 |
| ICF | - |
| IGA | Population=10,#Eval=10000,Alpha=0.5,Mutation=0.01 |
| IKNN | γ=0.1,ξ mul=0.2,ξ exp =-0.5 |
| MCNN | - |
| MCS | - |
| MENN | - |
| MNV | - |
| ModelCS | - |
| MSS | - |
| Multiedit | Number of Subblocks = 3 |
| NCNEdit | - |
| NRMCS | Error Threshold = 0.2 |
| POP | - |
| PSC | #Clusters=12 |
| PSRCG | - |
| Reconsistent | - |
| RMHC | Size StoT=10, #Mutations=10000 |
| RNG | Order of the Graph = 1st_order, Type of Selection = Edition |
| RNN | - |
| Shrink | - |
| SNN | - |
| SSMA | Population=30,#Eval=10000,Cross=0.5,Mutation=0.001 |
| SVBPS | Kernel=RBF,C =1000,eps=0.001,degree=10,γ=1.0,ν=0.5,p = 1.0,shrinking=0 |
| TCNN | - |
| TRKNN | α=1.2 |
| VSM | Number of Neighbors = 10 |
Data sets
The characteristics of the data sets used in the experimental study are shown as follows:

Data sets and 10-fcv partitions can be downloaded ![]()
Results
Below we provide several xls files including the full results obtained in the experiments. For each category, the following performance measures are considered: Accuracy (Training), Accuracy (Test), Kappa (Training), Kappa (Test), Reduction, Accuracy x Reduction(Training), Kappa x Reduction(Training), Accuracy x Reduction(Test), Kappa x Reduction(Test) and Time elapsed.
Additionally, the results of pairwise Wilcoxon tests (performed at a α=0.1 level) are reported for all pairwise comparisons among the methods regarding the following performance measures: Accuracy (Test), Kappa (Test), Accuracy x Reduction(Test) and Kappa x Reduction(Test).
Standard data sets without missing values
Experimental setup
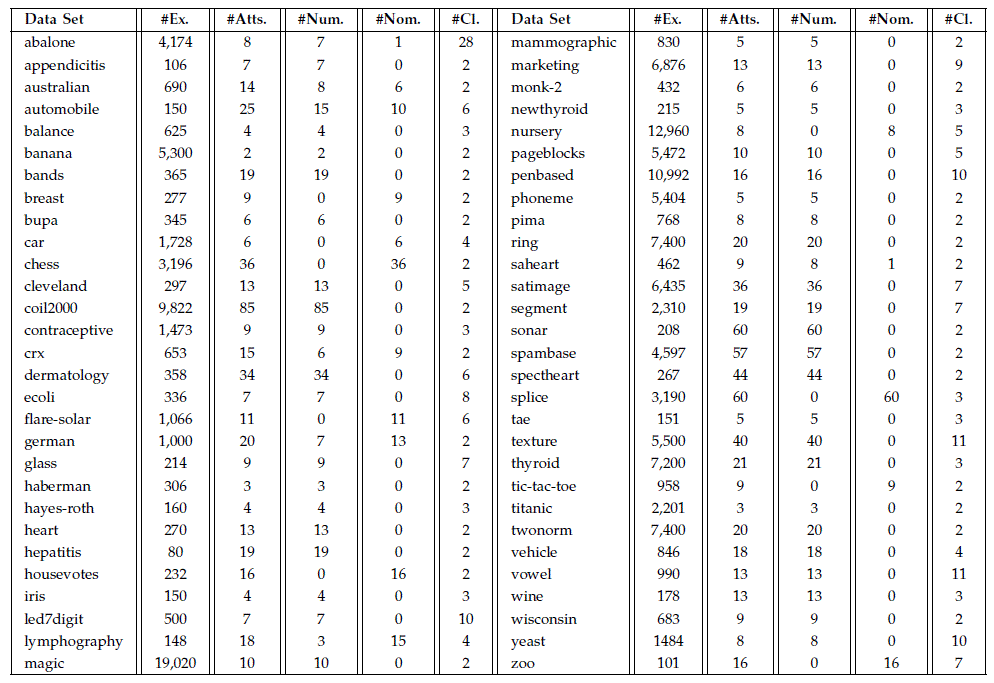
This section describes the experimental setup used for the comparison of the prototype selection methods over standard data sets without missing values. Firstly, a table shows the prototype selection methods included and the parameters set to each one (note that this configuration is the same for each dataset). Then, a second table describes the characteristics of the data sets selected to test the methods.
Prototype selection methods and parameters
Below is shown a table with the prototype selection methods considered and the relevant parameters used in the the experimental study.
All methods use the Euclidean Distance, and k values of 1 and 3 are considered.
| AllKNN | - |
| CCIS | - |
| CHC | Population=50,#Eval=10000,α=0.5,%inRestart=0.35 |
| CNN | - |
| CPruner | - |
| DROP3 | - |
| FCNN | - |
| GGA | Cross= 0.6, Population=51,#Eval=10000,Alpha=0.5, Mutation=0.01 |
| HMNEI | ε= 0.1 |
| IB3 | Confidence Acceptance = 0.9, Confidence Dropping = 0.7 |
| ICF | - |
| MCNN | - |
| MENN | - |
| ModelCS | - |
| MSS | - |
| POP | - |
| Reconsistent | - |
| RMHC | Size StoT=10, #Mutations=10000 |
| RNG | Order of the Graph = 1st_order, Type of Selection = Edition |
| RNN | - |
| SSMA | Population=30,#Eval=10000,Cross=0.5,Mutation=0.001 |
Data sets
The characteristics of the data sets used in the experimental study are shown as follows:

Data sets and 10-fcv partitions can be downloaded ![]()
Results
Below we provide several xls files including the full results obtained in the experiments. For each category, the following performance measures are considered: Accuracy (Training), Accuracy (Test), Kappa (Training), Kappa (Test). The results of the first experiment also includes the Reduction and Time elapsed performance measures.
Large data sets and missing value imputation
Experimental setup
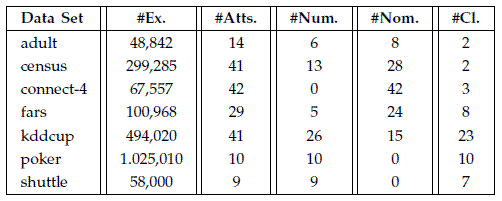
This section describes the experimental setup used for the comparison of the prototype selection methods over standard data sets without missing values. Firstly, two tables show the prototype selection methods included, the parameters set to each one and the parameters considered for stratification (note that this configuration is the same for each dataset). Then, a third table describes the characteristics of the data sets selected to test the methods.
Prototype selection methods and parameters
All methods use the Euclidean Distance, and k values of 1 and 3 are considered.
Below is shown a table with the prototype selection methods considered and the relevant parameters used in the the experimental study.
| CCIS | - |
| DROP3 | - |
| FCNN | - |
| HMNEI | ε= 0.1 |
| RMHC | Size StoT=10, #Mutations=10000 |
| RNG | Order of the Graph = 1st_order, Type of Selection = Edition |
| SSMA | Population=30,#Eval=10000,Cross=0.5,Mutation=0.001 |
| BBD-Tree | ε= 0.1, Bucket size =3, Splitting Rule = Sliding- midpoint rule, Shrinking rule = Simple shrink rule, Search algorithm = Standard search |
| LSH | Hashing function = Random hyperplane |
For stratified methods, the strata size is selected triying to set it as near as possible to 10000 instances. Therefore, the number of strata selected for each data set is the following (all stratified PS methods shares this configuration)
| Dataset | Total instances | Training instances | #Strata | Instances/Strata |
| adult | 48842 | 43958 | 4 | 10989 |
| census | 299285 | 269357 | 27 | 9976 |
| connect-4 | 67557 | 60801 | 6 | 10133 |
| fars | 100968 | 90871 | 9 | 10096 |
| kddcup | 494020 | 444618 | 45 | 9880 |
| poker | 1025010 | 922509 | 92 | 10027 |
| shuttle | 58000 | 52200 | 5 | 10440 |
Data sets
The characteristics of the data sets employed in the experimental study are shown as follows:

Results
Below we provide an xls file including the full results obtained in the experiments.The following performance measures are considered: Accuracy (Training), Accuracy (Test), Kappa (Training), Kappa (Test), Reduction, Accuracy x Reduction(Training), Kappa x Reduction(Training), Accuracy x Reduction(Test), Kappa x Reduction(Test), Time elapsed (Model), Time elapsed (Training) and Time elapsed (Test).
Additionally, the results of pairwise Wilcoxon tests (performed at a α=0.1 level) are reported for all pairwise comparisons among the methods regarding the following performance measures: Accuracy (Test), Kappa (Test), Accuracy x Reduction(Test) and Kappa x Reduction(Test).
