
A Taxonomy and Experimental Study on Prototype Generation for Nearest Neighbor Classification - Complementary Material
This Website contains additional material to the SCI2S research paper on Prototype Generation
I. Triguero, J. Derrac, S. García and F.Herrera, A Taxonomy and Experimental Study on Prototype Generation for Nearest Neighbor Classification . IEEE Transactions on Systems, Man, and Cybernetics--Part C: Applications and Reviews 42 (1) (2012) 86-100, doi: 10.1109/TSMCC.2010.2103939 ![]()
Summary:
Experimental study
Experimental set up
This section describes the experimental set up employed for the comparison of the PG methods.
First, a table shows the parameters set to each method (note that it remain unchanged for each dataset). Then, another table shows the characteristics of the data sets employed to test the methods.
Parameters
Many different configurations are established by the authors in each paper for the PG techniques. We focus this experimentation on the recommended parameters proposed by their respective authors, assuming that the choice of the values of the parameters was optimally chosen. Note that some PG methods have no parameters to be fixed, so they are not included in this table. In most of techniques, euclidean distance is used as similarity function, to decide which neighbors are closest. Furthermore, to avoid problems with large number of attributes and distances, all data set have been normalized between 0 and 1. Furthermore, the parameter Reduction Rate on fixed reduction algorithms has been established to 95% for small size data set, 98% for large size.
| LVQ3 | Iterations = 100, α = 0.1, WindowWidth=0.2 ε = 0.1 |
| DSM | Iterations = 100, α = 0.1 |
| VQ | Iterations = 100, α = 0.1 |
| BTS3 | NN selected = 1, Random Trials = 3 |
| LVQTC | Iterations = 100, α = 0.1, αW = 0.1, Retention Threshold = 3, Number of Epoches= 4 |
| MSE | Gradient Step = 0.5, Initial Temperature = 100 |
| ICPL2 | Filtering method = RT2 |
| Depur | k' = 2, k = 3 |
| HYB | Search Iterations = 200, Optimal search Iterations = 1000. α = 0.1 , Initial ε = 0, Final ε = 0.5, Initial WindowWidth = 0, Final WindowWidth = 0.5, δ = 0.1, delta WindowWidth = 0.1 Initial Selection = SVM |
| RPS3 | Subset Choice = Diameter |
| ENPC | Iterations = 250 |
| AVQ | Iterations = 100, T set percentage= 80%, ε = 0.1 |
| LVQPRU | Iterations = 100, α = 0.1 ,WindowWidth = 0.5 |
| POCNN | α ratio = 0.2 |
| SGP | Rmin = 0.01, Rmis = 0.2 |
| AMPSO | Iterations = 300, C1 = 1.0, C2 = 1.0, C3 = 0.25 Vmax = 1, W = 0.1, X = 0.5, Pr = 0.1, Pd = 0.1 |
| PSCSA | HyperMutation Rate = 2, Clonal Rate = 10, Mutation Rate = 0.01, Stimulation Threshold = 0.89, α = 0.4 |
| PSO | SwarmSize = 20, Iterations = 250, C1 = 1, C2 = 3, Vmax = 0.25, Wstart = 1.5, Wend = 0.5 |
Table 1. Parameter specification for all the methods employed in the experimentation
Data sets
The characteristics of the data sets employed in the experimental study are shown as follows:
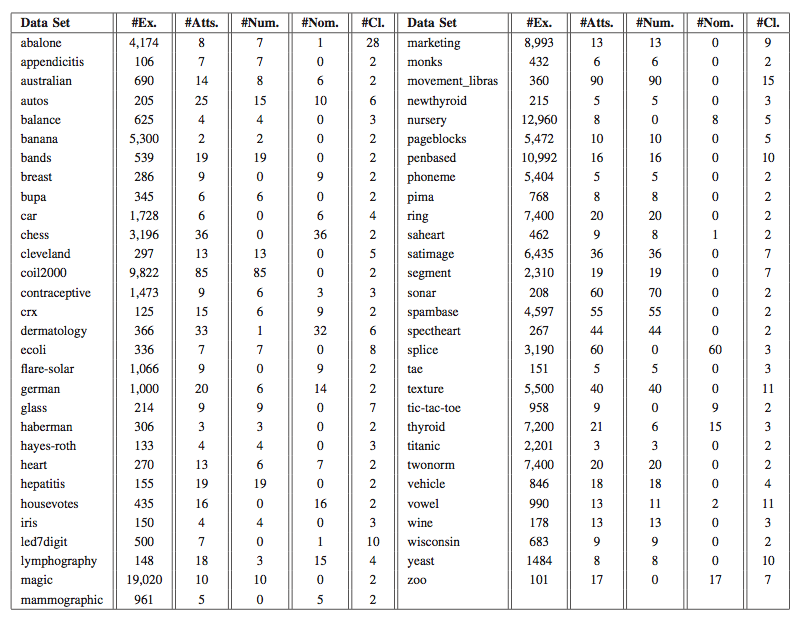
Table 2. Summary description for classification data sets
Results obtained
This section shows the results of the experimentation performed. There are 18 tables, categorized in 2 sections: Small datasets, Large datasets.
Each section contains 12 tables: 3 showing results in training phase (Accuracy, Kappa, Reduction), 2 showing results in test phase (Accuracy, Kappa), 1 showing the execution times, 1 summary table containing the average results and 5 different summaries taking into consideration numerical, nominal, mixed, binary and multi-class data sets. Note that in every table (excepting the summary tables), the best average result is highlighted in red and relevant data sets are identified in green.
Small Data Sets
Accuracy(Training)
Tabla demasiado grande
Kappa(Training)
Tabla demasiado grande
Reduction(Training)
Tabla demasiado grande
Accuracy(Test)
Tabla demasiado grande
Kappa(Test)
Tabla demasiado grande
Execution Time
Tabla demasiado grande
Summary
| Red | train Acc | train Kappa | test Acc | test Kappa | Time | ||||||
| PSCSA | 0.9858 | MCA | 0.8772 | MCA | 0.7717 | GENN | 0.7564 | GENN | 0.5400 | 1NN | |
| AVQ | 0.9759 | GMCA | 0.8405 | GMCA | 0.7067 | ICPL | 0.76 | ICPL | 0.5366 | LVQTC | 0.1644 |
| LVQTC | 0.9551 | HYB | 0.8309 | HYB | 0.6988 | PSO | 0.7501 | PSO | 0.5332 | DSM | 0.1780 |
| MixtGauss | 0.9552 | ICPL | 0.8254 | ENPC | 0.6800 | GMCA | 0.7351 | GMCA | 0.5062 | BTS3 | 0.2079 |
| MSE | 0.9520 | ENPC | 0.8247 | PSO | 0.6791 | 1NN | 0.7326 | RSP | 0.5004 | LVQ3 | 0.2316 |
| Chen | 0.9519 | PSO | 0.8238 | ICPL | 0.67 | RSP3 | 0.7325 | MSE | 0.4825 | VQ | 0.2469 |
| BTS3 | 0.9519 | GENN | 0.8002 | GENN | 0.6243 | Depur | 0.7296 | 1NN | 0.4918 | Chen | 0.2675 |
| SGP | 0.9512 | RSP3 | 0.7924 | RSP3 | 0.6112 | MSE | 0.7237 | MCA | 0.4867 | Depur | 0.2777 |
| LVQPRU | 0.9503 | Depur | 0.7801 | Depur | 0.5815 | MCA | 0.7219 | Depur | 0.4826 | LVQPRU | 0.5592 |
| PSO | 0.9491 | MSE | 0.7566 | MSE | 0.5388 | ENPC | 0.7167 | ENPC | 0.4818 | AVQ | 0.6561 |
| VQ | 0.9491 | 1NN | 0.7369 | LVQTC | 0.5224 | HYB | 0.7153 | HYB | 0.4790 | MixtGauss | 0.8125 |
| DSM | 0.9491 | LVQTC | 0.7327 | Chen | 0.5116 | LVQPRU | 0.6997 | LVQPRU | 0.4592 | SGP | 1.3597 |
| LVQ3 | 0.9488 | LVQPRU | 0.7304 | LVQPRU | 0.5110 | LVQTC | 0.6981 | MixtGauss | 0.4546 | GENN | 1.4285 |
| PNN | 0.9447 | SGP | 0.7256 | AMPSO | 0.5039 | SGP | 0.6949 | LVQTC | 0.4541 | RSP3 | 1.8505 |
| AMPSO | 0.9430 | AMPSO | 0.7227 | 1NN | 0.4985 | MixtGauss | 0.6932 | AMPSO | 0.4440 | PSCSA | 1.9562 |
| MCA | 0.8568 | MixtGauss | 0.7138 | MixtGauss | 0.4888 | AMPSO | 0.6903 | PNN | 0.4369 | MSE | 2.4794 |
| ICPL | 0.8371 | DSM | 0.7036 | SGP | 0.4852 | DSM | 0.6810 | SGP | 0.4360 | HYB | 5.5888 |
| RSP3 | 0.7329 | PNN | 0.7015 | PNN | 0.4718 | PNN | 0.6786 | AVQ | 0.4326 | AMPSO | 8.2870 |
| ENPC | 0.7220 | Chen | 0.6964 | AVQ | 0.4660 | Chen | 0.6770 | DSM | 0.4239 | GMCA | 8.4947 |
| GMCA | 0.6984 | LVQ3 | 0.6931 | DSM | 0.4627 | LVQ3 | 0.6763 | PSCSA | 0.4231 | PNN | 14.0066 |
| POC | 0.6071 | AVQ | 0.6869 | PSCSA | 0.4461 | PSCSA | 0.6682 | LVQ3 | 0.4114 | PSO | 42.3168 |
| HYB | 0.4278 | PSCSA | 0.6787 | LVQ3 | 0.4421 | AVQ | 0.6672 | Chen | 0.4026 | ENPC | 47.1377 |
| Depur | 0.3531 | BTS3 | 0.6713 | BTS3 | 0.3923 | BTS3 | 0.6626 | BTS3 | 0.3784 | POC | 151.9278 |
| GENN | 0.1862 | VQ | 0.6614 | VQ | 0.3866 | VQ | 0.6549 | VQ | 0.3770 | ICPL | 163.9147 |
| 1NN | 0.0000 | POC | 0.6487 | POC | 0.3601 | POC | 0.6493 | POC | 0.3700 | MCA | 190.4930 |
Table 9. Summary Results for small data sets
Summary with numerical small data sets
| train Acc | train Kappa | test Acc | test Kappa | ||||
| MCA | 0.9131 | MCA | 0.8384 | PSO | 0.7531 | PSO | 0.5341 |
| GMCA | 0.8534 | GMCA | 0.7326 | ICPL | 0.7449 | GENN | 0.5232 |
| HYB | 0.8426 | HYB | 0.7306 | GENN | 0.7447 | ICPL | 0.5156 |
| ENPC | 0.8416 | ENPC | 0.7090 | GMCA | 0.7258 | GMCA | 0.4929 |
| PSO | 0.8320 | PSO | 0.6925 | MSE | 0.7233 | MCA | 0.4880 |
| ICPL | 0.8216 | ICPL | 0.6587 | 1NN | 0.7280 | 1NN | 0.4804 |
| GENN | 0.7942 | GENN | 0.6164 | Depur | 0.7265 | MSE | 0.4796 |
| RSP3 | 0.7916 | RSP3 | 0.6150 | RSP3 | 0.7216 | Depur | 0.4758 |
| Depur | 0.7844 | Depur | 0.5914 | MCA | 0.7192 | ENPC | 0.4734 |
| MSE | 0.7634 | MSE | 0.5501 | ENPC | 0.7103 | RSP | 0.4891 |
| LVQTC | 0.7446 | LVQTC | 0.5438 | LVQPRU | 0.7060 | HYB | 0.4779 |
| LVQPRU | 0.7415 | LVQPRU | 0.5281 | HYB | 0.7076 | LVQPRU | 0.4677 |
| SGP | 0.7435 | SGP | 0.5123 | SGP | 0.7056 | LVQTC | 0.4547 |
| 1NN | 0.7322 | PNN | 0.4988 | MixtGauss | 0.6921 | MixtGauss | 0.4485 |
| AMPSO | 0.7224 | AMPSO | 0.4979 | LVQTC | 0.6998 | SGP | 0.4440 |
| PNN | 0.7196 | MixtGauss | 0.4973 | AMPSO | 0.6881 | PNN | 0.4400 |
| MixtGauss | 0.7191 | 1NN | 0.4925 | PNN | 0.6854 | AMPSO | 0.4325 |
| DSM | 0.7128 | AVQ | 0.4797 | DSM | 0.6739 | AVQ | 0.4315 |
| LVQ3 | 0.6958 | DSM | 0.4791 | PSCSA | 0.6753 | PSCSA | 0.4214 |
| AVQ | 0.6925 | PSCSA | 0.4539 | BTS3 | 0.6720 | DSM | 0.4088 |
| Chen | 0.6915 | LVQ3 | 0.4419 | Chen | 0.6717 | POC | 0.4028 |
| PSCSA | 0.6892 | Chen | 0.4150 | LVQ3 | 0.6712 | LVQ3 | 0.3952 |
| BTS3 | 0.6765 | POC | 0.3920 | AVQ | 0.6647 | Chen | 0.3843 |
| POC | 0.6611 | BTS3 | 0.3871 | POC | 0.6623 | BTS3 | 0.3817 |
| VQ | 0.6530 | VQ | 0.3710 | VQ | 0.6405 | VQ | 0.3510 |
Table 10. Summary Results for numerical small data sets
Summary with nominal small data sets
| train Acc | train Kappa | test Acc | test Kappa | ||||
| PSO | 0.8530 | PSO | 0.6726 | ICPL | 0.8029 | ICPL | 0.5622 |
| ICPL | 0.8418 | ICPL | 0.6566 | PSO | 0.8014 | PSO | 0.5561 |
| GENN | 0.8310 | GENN | 0.6272 | GENN | 0.8012 | GENN | 0.5546 |
| GMCA | 0.8076 | GMCA | 0.5905 | GMCA | 0.7766 | GMCA | 0.5189 |
| Depur | 0.8013 | MCA | 0.5737 | Depur | 0.7731 | AMPSO | 0.4930 |
| MCA | 0.7892 | ENPC | 0.5553 | 1NN | 0.7689 | ENPC | 0.4822 |
| RSP3 | 0.7879 | HYB | 0.5529 | AMPSO | 0.7619 | RSP3 | 0.4779 |
| HYB | 0.7815 | RSP3 | 0.5417 | RSP3 | 0.7617 | 1NN | 0.4730 |
| AMPSO | 0.7811 | AMPSO | 0.5358 | MSE | 0.7560 | MSE | 0.4719 |
| ENPC | 0.7752 | Depur | 0.5355 | VQ | 0.7461 | MCA | 0.4676 |
| MSE | 0.7708 | MSE | 0.5075 | LVQ3 | 0.7438 | HYB | 0.4672 |
| 1NN | 0.7687 | LVQTC | 0.4794 | DSM | 0.7435 | Depur | 0.4670 |
| LVQTC | 0.7542 | 1NN | 0.4768 | HYB | 0.7423 | PSCSA | 0.4667 |
| VQ | 0.7447 | PSCSA | 0.4671 | LVQTC | 0.7412 | SGP | 0.4604 |
| Chen | 0.7444 | LVQPRU | 0.4668 | LVQPRU | 0.7388 | LVQPRU | 0.4603 |
| LVQPRU | 0.7426 | Chen | 0.4641 | PSCSA | 0.7384 | LVQ3 | 0.4582 |
| LVQ3 | 0.7382 | MixtGauss | 0.4550 | MCA | 0.7357 | DSM | 0.4520 |
| MixtGauss | 0.7367 | SGP | 0.4499 | ENPC | 0.7346 | LVQTC | 0.4487 |
| DSM | 0.7338 | VQ | 0.4476 | Chen | 0.7327 | MixtGauss | 0.4471 |
| PSCSA | 0.7326 | LVQ3 | 0.4467 | SGP | 0.7292 | VQ | 0.4441 |
| SGP | 0.7289 | AVQ | 0.4389 | MixtGauss | 0.7288 | Chen | 0.4356 |
| AVQ | 0.7173 | DSM | 0.4307 | AVQ | 0.7147 | AVQ | 0.4281 |
| BTS3 | 0.7146 | BTS3 | 0.3913 | BTS3 | 0.7084 | PNN | 0.3966 |
| PNN | 0.6811 | PNN | 0.3817 | PNN | 0.6783 | BTS3 | 0.3831 |
| POC | 0.6106 | POC | 0.2053 | POC | 0.6087 | POC | 0.2191 |
Table 11. Summary Results for nominal small data sets
Summary with mixed small data sets
| train Acc | train Kappa | test Acc | test Kappa | ||||
| GMCA | 0.8837 | MCA | 0.7823 | GENN | 0.7905 | GENN | 0.5790 |
| MCA | 0.8833 | GMCA | 0.7732 | ICPL | 0.7882 | ICPL | 0.5772 |
| HYB | 0.8784 | HYB | 0.7654 | PSO | 0.7792 | PSO | 0.5618 |
| ENPC | 0.8684 | ENPC | 0.7453 | 1NN | 0.7714 | RSP3 | 0.5479 |
| ICPL | 0.8634 | ICPL | 0.7264 | RSP3 | 0.7698 | 1NN | 0.5421 |
| PSO | 0.8515 | PSO | 0.7050 | GMCA | 0.7639 | GMCA | 0.5304 |
| GENN | 0.8355 | RSP3 | 0.6634 | Depur | 0.7624 | Depur | 0.5294 |
| RSP3 | 0.8308 | GENN | 0.6624 | MSE | 0.7562 | MSE | 0.5180 |
| Depur | 0.8041 | Depur | 0.6111 | LVQTC | 0.7481 | LVQTC | 0.5124 |
| MSE | 0.7815 | LVQTC | 0.5684 | ENPC | 0.7346 | PNN | 0.4897 |
| LVQTC | 0.7777 | MSE | 0.5552 | MCA | 0.7285 | AVQ | 0.4888 |
| 1NN | 0.7721 | 1NN | 0.5425 | PNN | 0.7268 | MixtGauss | 0.4868 |
| LVQPRU | 0.7449 | LVQPRU | 0.5247 | HYB | 0.7261 | ENPC | 0.4779 |
| Chen | 0.7391 | AMPSO | 0.5189 | Chen | 0.7245 | MCA | 0.4721 |
| AMPSO | 0.7370 | MixtGauss | 0.5035 | MixtGauss | 0.7236 | PSCSA | 0.4651 |
| MixtGauss | 0.7335 | AVQ | 0.4990 | AVQ | 0.7159 | HYB | 0.4650 |
| PNN | 0.7301 | PNN | 0.4974 | DSM | 0.7121 | AMPSO | 0.4646 |
| DSM | 0.7241 | Chen | 0.4837 | LVQPRU | 0.7104 | DSM | 0.4635 |
| AVQ | 0.7234 | DSM | 0.4794 | AMPSO | 0.7051 | LVQPRU | 0.4619 |
| LVQ3 | 0.7216 | PSCSA | 0.4787 | PSCSA | 0.6987 | Chen | 0.4548 |
| SGP | 0.7166 | LVQ3 | 0.4723 | LVQ3 | 0.6981 | LVQ3 | 0.4322 |
| BTS3 | 0.7145 | BTS3 | 0.4502 | BTS3 | 0.6971 | BTS3 | 0.4141 |
| PSCSA | 0.7111 | SGP | 0.4480 | VQ | 0.6812 | VQ | 0.4033 |
| VQ | 0.6807 | VQ | 0.3977 | SGP | 0.6806 | SGP | 0.3979 |
| POC | 0.6806 | POC | 0.3947 | POC | 0.6765 | POC | 0.3917 |
Table 12. Summary Results for mixed small data sets
Summary with binary small data sets
| train Acc | train Kappa | test Acc | test Kappa | ||||
| MCA | 0.8660 | MCA | 0.7079 | PSO | 0.7782 | PSO | 0.4725 |
| PSO | 0.8526 | HYB | 0.6623 | ICPL | 0.7721 | ICPL | 0.4702 |
| GMCA | 0.8497 | GMCA | 0.6603 | GENN | 0.7712 | GENN | 0.4678 |
| ICPL | 0.8430 | PSO | 0.6510 | PSCSA | 0.7508 | PSCSA | 0.4240 |
| HYB | 0.8415 | ENPC | 0.6342 | MSE | 0.7484 | LVQTC | 0.4178 |
| ENPC | 0.8370 | ICPL | 0.6340 | Depur | 0.7477 | GMCA | 0.4169 |
| GENN | 0.8212 | GENN | 0.5841 | LVQTC | 0.7460 | AMPSO | 0.4158 |
| Depur | 0.8048 | RSP3 | 0.5509 | GMCA | 0.7448 | MSE | 0.4111 |
| RSP3 | 0.8028 | Depur | 0.5272 | 1NN | 0.7439 | 1NN | 0.4106 |
| LVQTC | 0.7782 | LVQTC | 0.4940 | AMPSO | 0.7406 | RSP3 | 0.4092 |
| AMPSO | 0.7763 | AMPSO | 0.4932 | RSP3 | 0.7386 | Depur | 0.3922 |
| MSE | 0.7716 | MSE | 0.4626 | Chen | 0.7379 | MixtGauss | 0.3901 |
| PSCSA | 0.7664 | PSCSA | 0.4609 | MixtGauss | 0.7342 | ENPC | 0.3855 |
| Chen | 0.7544 | LVQPRU | 0.4372 | BTS3 | 0.7268 | LVQPRU | 0.3813 |
| 1NN | 0.7493 | 1NN | 0.4252 | LVQPRU | 0.7237 | Chen | 0.3801 |
| MixtGauss | 0.7490 | MixtGauss | 0.4242 | ENPC | 0.7222 | MCA | 0.3776 |
| LVQPRU | 0.7477 | Chen | 0.4136 | SGP | 0.7186 | AVQ | 0.3680 |
| SGP | 0.7372 | AVQ | 0.3991 | LVQ3 | 0.7168 | HYB | 0.3640 |
| DSM | 0.7350 | DSM | 0.3954 | DSM | 0.7135 | PNN | 0.3534 |
| LVQ3 | 0.7341 | SGP | 0.3953 | VQ | 0.7132 | SGP | 0.3525 |
| BTS3 | 0.7278 | PNN | 0.3866 | MCA | 0.7128 | DSM | 0.3509 |
| PNN | 0.7138 | LVQ3 | 0.3857 | HYB | 0.7012 | LVQ3 | 0.3471 |
| AVQ | 0.7137 | BTS3 | 0.3462 | AVQ | 0.6994 | BTS3 | 0.3437 |
| VQ | 0.7096 | VQ | 0.3378 | PNN | 0.6977 | VQ | 0.3411 |
| POC | 0.6286 | POC | 0.2028 | POC | 0.6358 | POC | 0.2259 |
Table 13. Summary Results for binary small data sets
Summary with multi-class small data sets
| train Acc | train Kappa | test Acc | test Kappa | ||||
| MCA | 0.8823 | MCA | 0.8226 | GENN | 0.7427 | GENN | 0.6238 |
| GMCA | 0.8266 | GMCA | 0.7446 | ICPL | 0.7399 | ICPL | 0.6218 |
| HYB | 0.8151 | HYB | 0.7266 | MCA | 0.7302 | MCA | 0.6035 |
| ICPL | 0.8089 | ICPL | 0.7223 | 1NN | 0.7280 | PSO | 0.6034 |
| ENPC | 0.8069 | ENPC | 0.7156 | HYB | 0.7275 | HYB | 0.6005 |
| PSO | 0.7933 | PSO | 0.7095 | RSP3 | 0.7262 | GMCA | 0.6002 |
| RSP3 | 0.7819 | GENN | 0.6779 | GMCA | 0.7247 | RSP3 | 0.5985 |
| GENN | 0.7809 | RSP3 | 0.6777 | PSO | 0.7214 | 1NN | 0.5922 |
| Depur | 0.7559 | Depur | 0.6455 | Depur | 0.7106 | ENPC | 0.5817 |
| MSE | 0.7412 | MSE | 0.6240 | ENPC | 0.7095 | Depur | 0.5804 |
| 1NN | 0.7272 | 1NN | 0.5908 | MSE | 0.6981 | MSE | 0.5647 |
| LVQPRU | 0.7122 | LVQPRU | 0.5889 | LVQPRU | 0.6760 | LVQPRU | 0.5423 |
| SGP | 0.7093 | SGP | 0.5770 | SGP | 0.6678 | POC | 0.5255 |
| PNN | 0.6850 | PNN | 0.5541 | POC | 0.6654 | SGP | 0.5248 |
| LVQTC | 0.6838 | MixtGauss | 0.5518 | PNN | 0.6561 | MixtGauss | 0.5213 |
| MixtGauss | 0.6758 | LVQTC | 0.5495 | MixtGauss | 0.6507 | PNN | 0.5201 |
| POC | 0.6690 | AVQ | 0.5328 | LVQTC | 0.6482 | DSM | 0.5030 |
| DSM | 0.6678 | DSM | 0.5295 | DSM | 0.6462 | AVQ | 0.4983 |
| AMPSO | 0.6675 | AMPSO | 0.5292 | AMPSO | 0.6371 | LVQTC | 0.4951 |
| AVQ | 0.6600 | POC | 0.5237 | AVQ | 0.6348 | LVQ3 | 0.4858 |
| LVQ3 | 0.6492 | LVQ3 | 0.5023 | LVQ3 | 0.6341 | AMPSO | 0.4846 |
| Chen | 0.6366 | Chen | 0.4768 | Chen | 0.6134 | Chen | 0.4444 |
| BTS3 | 0.6153 | PSCSA | 0.4502 | BTS3 | 0.5991 | PSCSA | 0.4361 |
| VQ | 0.6120 | BTS3 | 0.4477 | VQ | 0.5959 | VQ | 0.4231 |
| PSCSA | 0.5968 | VQ | 0.4453 | PSCSA | 0.5891 | BTS3 | 0.4230 |
Table 14. Summary Results for multi-class small data sets
Large Data Sets
Accuracy(Training)
Tabla demasiado grande
Accuracy(Training)
Tabla demasiado grande
Accuracy(Training)
Tabla demasiado grande
Accuracy(Test)
Tabla demasiado grande
Kappa(Test)
Tabla demasiado grande
Execution Time
Tabla demasiado grande
Summary
| Red | train Acc | train Kappa | test Acc | test Kappa | Time | ||||||
| PSCSA | 0.9988 | ENPC | 0.8809 | ENPC | 0.7613 | GENN | 0.8133 | GENN | 0.6269 | 1NN | |
| AVQ | 0.9980 | GENN | 0.8428 | GENN | 0.6806 | 1NN | 0.8060 | 1NN | 0.6181 | DSM | 1.6849 |
| LVQTC | 0.9975 | Depur | 0.8250 | Depur | 0.6322 | ENPC | 0.8029 | ENPC | 0.6170 | LVQ3 | 1.7037 |
| MSE | 0.9936 | PSO | 0.8158 | RSP3 | 0.6299 | Depur | 0.8004 | Depur | 0.5863 | VQ | 1.7193 |
| SGP | 0.9823 | 1NN | 0.8057 | 1NN | 0.6178 | PSO | 0.8000 | PSO | 0.5861 | MSE | 17.4228 |
| BTS3 | 0.9801 | RSP3 | 0.7922 | PSO | 0.6173 | MSE | 0.7674 | RSP | 0.5597 | HYB | 18.6338 |
| Mixtgauss | 0.9801 | HYB | 0.7888 | HYB | 0.5992 | Chen | 0.7621 | HYB | 0.5567 | LVQPRU | 24.4067 |
| LVQPRU | 0.9801 | MSE | 0.7759 | MSE | 0.5349 | HYB | 0.7618 | MSE | 0.5221 | Depur | 26.8656 |
| Chen | 0.9801 | Chen | 0.7682 | Chen | 0.5236 | RSP3 | 0.7556 | Chen | 0.5116 | AVQ | 38.3665 |
| LVQ3 | 0.9799 | AMPSO | 0.7436 | BTS3 | 0.4859 | AMPSO | 0.7410 | LVQPRU | 0.4799 | Chen | 50.0435 |
| DSM | 0.9799 | BTS3 | 0.7393 | AMPSO | 0.4836 | BTS3 | 0.7399 | DSM | 0.4796 | SGP | 52.3400 |
| VQ | 0.9799 | LVQPRU | 0.7373 | LVQPRU | 0.4818 | LVQPRU | 0.7356 | BTS3 | 0.4788 | LVQTC | 83.6030 |
| PSO | 0.9799 | DSM | 0.7353 | DSM | 0.4795 | DSM | 0.7341 | AMPSO | 0.4784 | PSCSA | 160.3864 |
| AMPSO | 0.9797 | MixtGauss | 0.7345 | Mixtgauss | 0.4711 | Mixtgauss | 0.7318 | MixtGauss | 0.4661 | GENN | 167.4849 |
| ENPC | 0.8205 | LVQ3 | 0.7340 | VQ | 0.4689 | LVQ3 | 0.7318 | VQ | 0.4651 | BTS3 | 219.2394 |
| RSP3 | 0.8100 | VQ | 0.7322 | LVQ3 | 0.4683 | VQ | 0.7316 | LVQ3 | 0.4627 | AMPSO | 587.7181 |
| HYB | 0.5727 | LVQTC | 0.7065 | AVQ | 0.4321 | LVQTC | 0.7056 | AVQ | 0.4280 | RSP3 | 258.6881 |
| Depur | 0.2708 | PSCSA | 0.6730 | LVQTC | 0.4185 | PSCSA | 0.6707 | LVQTC | 0.4165 | MixtGauss | 639.3139 |
| GENN | 0.1576 | AVQ | 0.6546 | PSCSA | 0.3900 | AVQ | 0.6518 | PSCSA | 0.3842 | PSO | 909.9820 |
| 1NN | 0.0000 | SGP | 0.6162 | SGP | 0.3568 | SGP | 0.6086 | SGP | 0.3466 | ENPC | 10931.1977 |
Table 21. Summary results for large data sets
Summary with numerical large data sets
| train Acc | train Kappa | test Acc | test Kappa | ||||
| ENPC | 0.9091 | ENPC | 0.7936 | GENN | 0.8510 | GENN | 0.6712 |
| GENN | 0.8714 | GENN | 0.7102 | PSO | 0.8453 | ENPC | 0.6675 |
| PSO | 0.8580 | PSO | 0.6768 | ENPC | 0.8441 | 1NN | 0.6569 |
| Depur | 0.8516 | Depur | 0.6659 | 1NN | 0.8404 | PSO | 0.6501 |
| 1NN | 0.8403 | 1NN | 0.6568 | Depur | 0.8367 | Depur | 0.6338 |
| HYB | 0.8227 | RSP3 | 0.6532 | MSE | 0.8139 | HYB | 0.5954 |
| RSP3 | 0.8189 | HYB | 0.6326 | Chen | 0.8127 | Chen | 0.5939 |
| MSE | 0.8181 | Chen | 0.6034 | Mixtgauss | 0.7996 | MSE | 0.5826 |
| Chen | 0.8173 | MSE | 0.5892 | HYB | 0.7994 | RSP | 0.5804 |
| MixtGauss | 0.8018 | Mixtgauss | 0.5696 | AMPSO | 0.7926 | MixtGauss | 0.5654 |
| AMPSO | 0.7943 | AMPSO | 0.5633 | RSP3 | 0.7864 | AMPSO | 0.5589 |
| BTS3 | 0.7836 | DSM | 0.5444 | BTS3 | 0.7850 | BTS3 | 0.5452 |
| DSM | 0.7819 | BTS3 | 0.5423 | DSM | 0.7800 | DSM | 0.5423 |
| LVQ3 | 0.7800 | LVQPRU | 0.5415 | LVQPRU | 0.7782 | LVQPRU | 0.5410 |
| LVQPRU | 0.7795 | VQ | 0.5308 | LVQ3 | 0.7775 | VQ | 0.5274 |
| VQ | 0.7782 | LVQ3 | 0.5308 | VQ | 0.7770 | LVQ3 | 0.5239 |
| LVQTC | 0.7524 | AVQ | 0.5075 | LVQTC | 0.7521 | AVQ | 0.5036 |
| PSCSA | 0.7266 | LVQTC | 0.4895 | PSCSA | 0.7254 | LVQTC | 0.4883 |
| AVQ | 0.7249 | PSCSA | 0.4650 | AVQ | 0.7225 | PSCSA | 0.4594 |
| SGP | 0.6434 | SGP | 0.3831 | SGP | 0.6399 | SGP | 0.3780 |
Table 22. Summary results for numerical large data sets
Summary with nominal large data sets
| train Acc | train Kappa | test Acc | test Kappa | ||||
| GENN | 0.8590 | GENN | 0.7655 | 1NN | 0.8077 | 1NN | 0.6807 |
| ENPC | 0.8498 | ENPC | 0.7512 | HYB | 0.7988 | GENN | 0.6625 |
| Depur | 0.8370 | Depur | 0.7235 | GENN | 0.7952 | HYB | 0.6589 |
| HYB | 0.8170 | HYB | 0.6923 | ENPC | 0.7835 | ENPC | 0.6452 |
| 1NN | 0.8073 | 1NN | 0.6794 | RSP3 | 0.7704 | Depur | 0.6169 |
| RSP3 | 0.7815 | PSO | 0.6057 | Depur | 0.7689 | RSP3 | 0.5662 |
| PSO | 0.7568 | RSP3 | 0.5836 | PSO | 0.7262 | PSO | 0.5540 |
| MSE | 0.7140 | MSE | 0.5292 | MSE | 0.6858 | MSE | 0.4851 |
| LVQPRU | 0.6579 | LVQPRU | 0.4350 | LVQPRU | 0.6636 | LVQPRU | 0.4432 |
| BTS3 | 0.6494 | VQ | 0.4125 | VQ | 0.6476 | DSM | 0.4162 |
| VQ | 0.6455 | LVQ3 | 0.4117 | DSM | 0.6458 | VQ | 0.4144 |
| Chen | 0.6453 | BTS3 | 0.4114 | BTS3 | 0.6453 | LVQ3 | 0.4128 |
| LVQ3 | 0.6442 | AMPSO | 0.4066 | LVQ3 | 0.6438 | BTS3 | 0.4045 |
| DSM | 0.6398 | DSM | 0.4057 | Chen | 0.6369 | AMPSO | 0.3944 |
| AMPSO | 0.6295 | Chen | 0.3937 | AMPSO | 0.6215 | Chen | 0.3780 |
| SGP | 0.6239 | SGP | 0.3852 | SGP | 0.6169 | SGP | 0.3748 |
| LVQTC | 0.5913 | LVQTC | 0.3295 | LVQTC | 0.5888 | LVQTC | 0.3262 |
| AVQ | 0.5771 | AVQ | 0.3268 | AVQ | 0.5713 | AVQ | 0.3186 |
| MixtGauss | 0.5395 | PSCSA | 0.2503 | MixtGauss | 0.5362 | PSCSA | 0.2411 |
| PSCSA | 0.5313 | MixtGauss | 0.2143 | PSCSA | 0.5238 | MixtGauss | 0.2085 |
Table 23. Summary results for nominal large data sets
Summary with mixed large data sets
| train Acc | train Kappa | test Acc | test Kappa | ||||
| ENPC | 0.5031 | ENPC | 0.4435 | Chen | 0.2647 | Chen | 0.1537 |
| RSP3 | 0.3846 | RSP3 | 0.3031 | PSO | 0.2523 | Depur | 0.1430 |
| Depur | 0.3018 | HYB | 0.2109 | Depur | 0.2506 | PSO | 0.1378 |
| HYB | 0.2943 | GENN | 0.2060 | RSP3 | 0.2350 | RSP3 | 0.1327 |
| GENN | 0.2936 | Depur | 0.2014 | GENN | 0.2185 | GENN | 0.1220 |
| Chen | 0.2897 | Chen | 0.1826 | BTS3 | 0.2149 | BTS3 | 0.1132 |
| PSO | 0.2805 | SGP | 0.1817 | MSE | 0.2046 | MSE | 0.1094 |
| SGP | 0.2661 | PSO | 0.1700 | AMPSO | 0.2005 | 1NN | 0.1038 |
| MSE | 0.2202 | MSE | 0.1279 | LVQTC | 0.1993 | MixtGauss | 0.1034 |
| LVQPRU | 0.2142 | MixtGauss | 0.1142 | 1NN | 0.1991 | HYB | 0.1021 |
| BTS3 | 0.2131 | LVQPRU | 0.1121 | HYB | 0.1974 | ENPC | 0.0992 |
| LVQTC | 0.2051 | DSM | 0.1117 | ENPC | 0.1936 | SGP | 0.0975 |
| DSM | 0.2047 | BTS3 | 0.1109 | SGP | 0.1924 | DSM | 0.0946 |
| MixtGauss | 0.2024 | LVQ3 | 0.1043 | MixtGauss | 0.1907 | LVQ3 | 0.0920 |
| AMPSO | 0.2021 | 1NN | 0.1040 | DSM | 0.1895 | VQ | 0.0872 |
| LVQ3 | 0.1988 | VQ | 0.0892 | LVQ3 | 0.1888 | AMPSO | 0.0846 |
| 1NN | 0.1987 | LVQTC | 0.0875 | LVQPRU | 0.1885 | LVQPRU | 0.0820 |
| VQ | 0.1836 | AMPSO | 0.0866 | VQ | 0.1831 | LVQTC | 0.0812 |
| PSCSA | 0.1464 | PSCSA | 0.0833 | PSCSA | 0.1397 | PSCSA | 0.0803 |
| AVQ | 0.1160 | AVQ | 0.0635 | AVQ | 0.1126 | AVQ | 0.0638 |
Table 24. Summary results for mixed large data sets
Summary with binary large data sets
| train Acc | train Kappa | test Acc | test Kappa | ||||
| RSP3 | 0.9319 | ENPC | 0.7425 | RSP3 | 0.9110 | RSP3 | 0.6726 |
| ENPC | 0.9137 | RSP3 | 0.7363 | PSO | 0.8661 | PSO | 0.6020 |
| PSO | 0.8797 | GENN | 0.6423 | GENN | 0.8533 | ENPC | 0.5937 |
| GENN | 0.8747 | PSO | 0.6339 | ENPC | 0.8470 | GENN | 0.5920 |
| Depur | 0.8454 | Depur | 0.5741 | 1NN | 0.8361 | 1NN | 0.5690 |
| 1NN | 0.8353 | 1NN | 0.5682 | Depur | 0.8278 | Depur | 0.5327 |
| Chen | 0.8289 | HYB | 0.5455 | Chen | 0.8246 | Chen | 0.5123 |
| AMPSO | 0.8098 | Chen | 0.5226 | AMPSO | 0.8071 | HYB | 0.5079 |
| HYB | 0.8088 | AMPSO | 0.4973 | MSE | 0.8021 | AMPSO | 0.4916 |
| MSE | 0.8050 | MSE | 0.4765 | LVQTC | 0.7976 | MSE | 0.4704 |
| LVQTC | 0.7983 | LVQTC | 0.4670 | HYB | 0.7908 | LVQTC | 0.4656 |
| MixtGauss | 0.7895 | MixtGauss | 0.4531 | MixtGauss | 0.7880 | MixtGauss | 0.4501 |
| LVQ3 | 0.7844 | DSM | 0.4450 | LVQ3 | 0.7817 | LVQPRU | 0.4463 |
| VQ | 0.7822 | LVQPRU | 0.4439 | VQ | 0.7815 | DSM | 0.4428 |
| BTS3 | 0.7798 | BTS3 | 0.4418 | BTS3 | 0.7804 | BTS3 | 0.4425 |
| DSM | 0.7790 | VQ | 0.4387 | LVQPRU | 0.7785 | VQ | 0.4351 |
| LVQPRU | 0.7774 | LVQ3 | 0.4385 | DSM | 0.7780 | LVQ3 | 0.4318 |
| PSCSA | 0.7772 | PSCSA | 0.4236 | PSCSA | 0.7741 | PSCSA | 0.4153 |
| AVQ | 0.7212 | AVQ | 0.4184 | AVQ | 0.7181 | AVQ | 0.4130 |
| SGP | 0.6131 | SGP | 0.2448 | SGP | 0.6110 | SGP | 0.2405 |
Table 25. Summary results for binary large data sets
Summary with multi-class large data sets
| train Acc | train Kappa | test Acc | test Kappa | ||||
| ENPC | 0.8514 | ENPC | 0.7783 | 1NN | 0.7789 | 1NN | 0.6623 |
| GENN | 0.8141 | GENN | 0.7150 | GENN | 0.7772 | GENN | 0.6583 |
| Depur | 0.8066 | Depur | 0.6846 | Depur | 0.7757 | ENPC | 0.6379 |
| 1NN | 0.7791 | 1NN | 0.6625 | ENPC | 0.7632 | Depur | 0.6346 |
| HYB | 0.7707 | HYB | 0.6475 | PSO | 0.7405 | HYB | 0.6006 |
| PSO | 0.7583 | PSO | 0.6023 | MSE | 0.7362 | PSO | 0.5719 |
| MSE | 0.7496 | MSE | 0.5875 | HYB | 0.7357 | MSE | 0.5686 |
| Chen | 0.7135 | RSP3 | 0.5341 | Chen | 0.7059 | DSM | 0.5128 |
| BTS3 | 0.7028 | Chen | 0.5246 | BTS3 | 0.7034 | BTS3 | 0.5115 |
| LVQPRU | 0.7011 | LVQPRU | 0.5159 | LVQPRU | 0.6971 | Chen | 0.5109 |
| DSM | 0.6960 | DSM | 0.5106 | DSM | 0.6946 | LVQPRU | 0.5101 |
| LVQ3 | 0.6887 | BTS3 | 0.5076 | LVQ3 | 0.6868 | VQ | 0.4920 |
| VQ | 0.6872 | VQ | 0.4961 | VQ | 0.6866 | LVQ3 | 0.4905 |
| MixtGauss | 0.6850 | LVQ3 | 0.4952 | AMPSO | 0.6816 | MixtGauss | 0.4806 |
| AMPSO | 0.6841 | MixtGauss | 0.4874 | MixtGauss | 0.6811 | AMPSO | 0.4666 |
| RSP3 | 0.6664 | AMPSO | 0.4714 | LVQTC | 0.6228 | RSP3 | 0.4581 |
| LVQTC | 0.6239 | SGP | 0.4577 | RSP3 | 0.6157 | SGP | 0.4420 |
| SGP | 0.6189 | AVQ | 0.4445 | SGP | 0.6065 | AVQ | 0.4415 |
| AVQ | 0.5946 | LVQTC | 0.3749 | AVQ | 0.5921 | LVQTC | 0.3724 |
| PSCSA | 0.5793 | PSCSA | 0.3597 | PSCSA | 0.5777 | PSCSA | 0.3562 |
Table 26. Summary results for multi-class large data sets
Statistical Test
In this paper, we use the hypothesis testing techniques to provide statistical support for the analysis of the results. Specifically, we use non-parametric tests, due to the fact that the initial conditions that guarantee the reliability of the parametric tests may not be satisfied, causing the statistical analysis to lose credibility with these parametric tests. These tests are suggested in the studies presented in different papers where its use in the field of Machine Learning is highly recommended. The Wilcoxon test is adopted considering a level of significance of α = 0.1
The tables shown in this paper collect all the possible comparisons employing the Wilcoxon test among the PG methods considered. These tables also summarize the comparisons of four main performance measures used in this paper: tst Acc., tst Kap., Acc. * Red. and Kap. * Red.. Cells situated over the main diagonal (top zone of the table) correspond to tst Acc. and tst Kap., whereas cells situated under the main diagonal (bottom zone of the table) correspond to Acc. * Red. and Kap. * Red.. Note that each cell has two spaces to house a symbol. The above one corresponds to accuracy and the one situated below corresponds to kappa. The symbol represents the result of the Wilcoxon comparison and it can indicate that the method specified in the row is better than (+), worse than (--) or equal to (=) the method it corresponds to in the column. Double lines separate families of methods. Let us see a simple example depicted in Table 27. The example illustrates that method A is equal to B in tst Acc. and Kap. * Red., worse than B in tst Kap. and better than B in Acc. * Red..
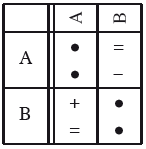
Table 27. Wilcoxon table example
Next tables present the Wilcoxon test results over small and large data sets respectively.
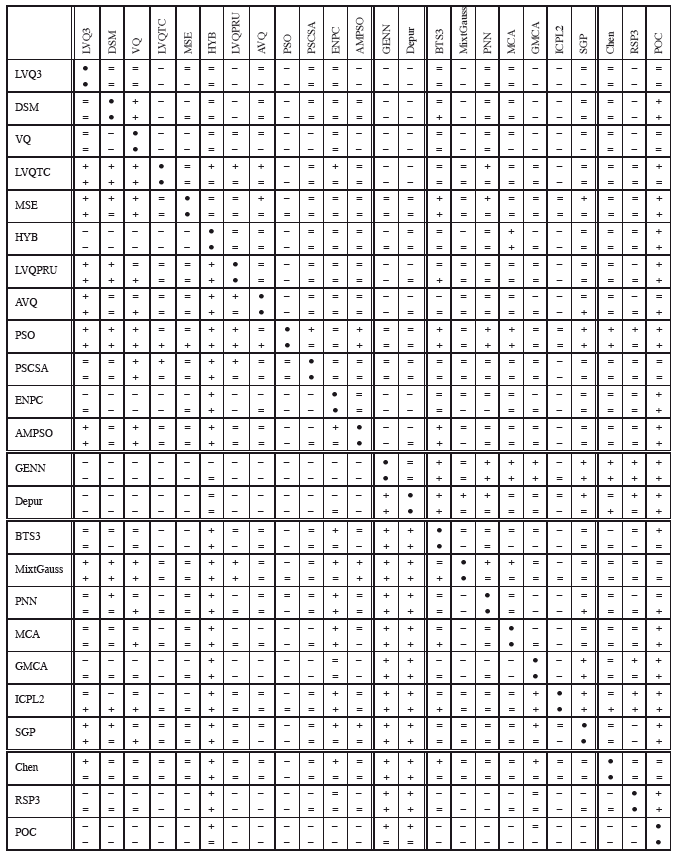
Table 28. Wilcoxon test results over small data sets
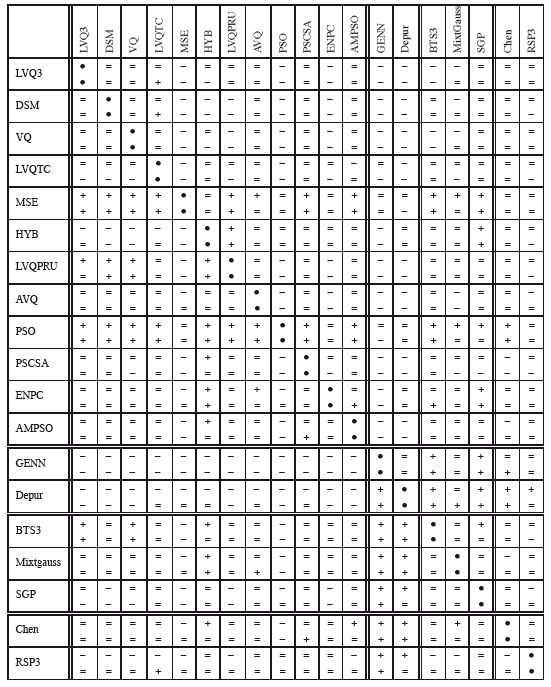
Table 29. Wilcoxon test results over large data sets