
Predicting Noise Filtering Efficacy with Data Complexity Measures for Nearest Neighbor Classification
This Website contains complementary material to the paper:
José A. Sáez, Julián Luengo, Francisco Herrera, Predicting Noise Filtering Efficacy with Data Complexity Measures for Nearest Neighbor Classification. Pattern Recognition 46:1 (2013) 355-364, doi: 10.1016/j.patcog.2012.07.009.
The web is organized according to the following summary:
- Abstract
- Data Complexity Measures
- Noise Filters
- Datasets and Results of 1-NN -with and without filtering
- Distribution of values of each Data Complexity Measure
Abstract
Classifier performance, particularly of instance-based learners such as k-Nearest Neighbors, is affected by the presence of noisy data. Noise filters are traditionally employed to remove these corrupted data and improve the classification performance. However, their efficacy depends on the properties of the data, which can be analyzed by what are known as data complexity measures. This paper studies the relation between the complexity metrics of a dataset and the efficacy of several noise filters to improve the performance of the nearest neighbor classifier. A methodology is proposed to extract a rule set based on data complexity measures that enables one to predict in advance whether the use of noise filters will be statistically profitable. The results obtained show that noise filtering efficacy is to a great extent dependent on the characteristics of the data analyzed by the measures. The validation process carried out shows that the final rule set provided is fairly accurate in predicting the efficacy of noise filters before their application and it produces an improvement with respect to the indiscriminate usage of noise filters.
Data Complexity Measures
This paper considers the following 11 measures:
Measures of class overlapping
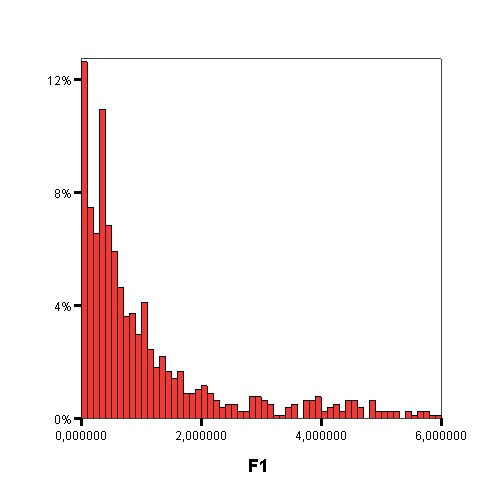
- F1 - Maximum Fisher's discriminant ratio
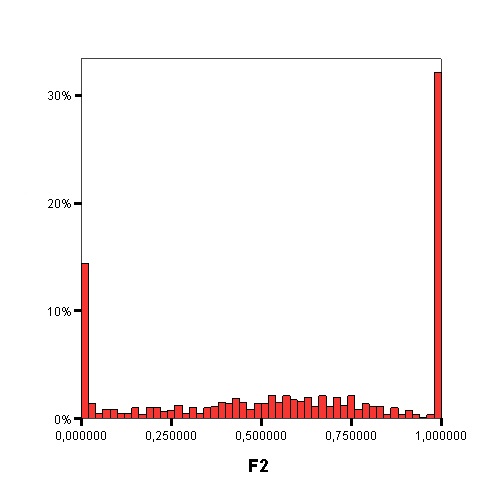
- F2 - Volume of the overlapping region
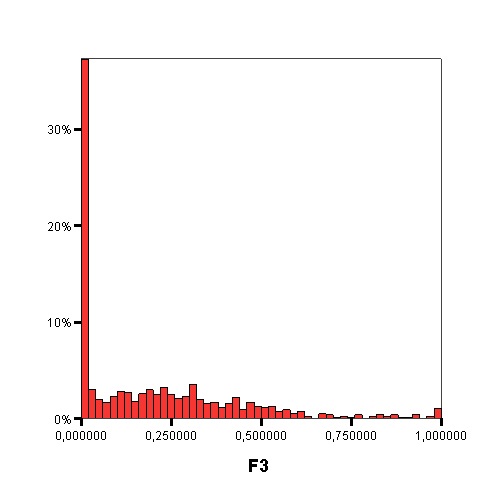
- F3 - Maximum feature efficiency
Measures of separability of classes
- L1 - Minimized sum of error distance by linear programming
- L2 - Error rate of linear classifier by linear programming
- N1 - Rate of points connected to the opposite class by a minimum spanning tree
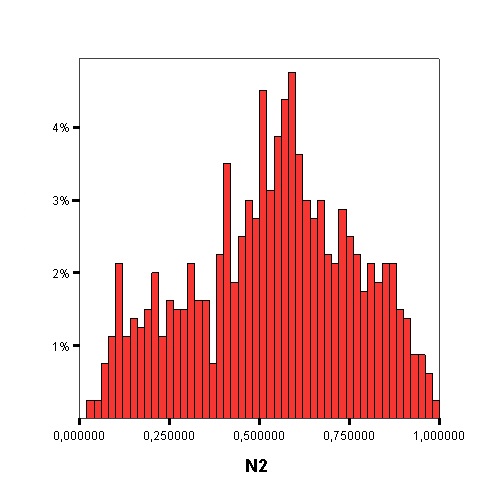
- N2 - Ratio of average intra/inter class nearest neighbor distance
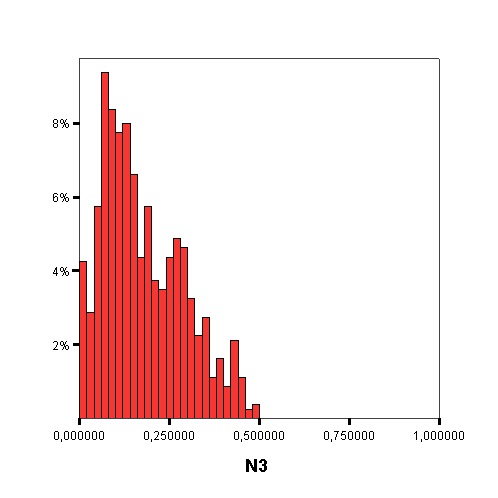
- N3 - Error rate of the 1-NN classifier
Measures of geometry, topology, and density of manifolds
- L3 - Nonlinearity of a linear classifier by linear programming
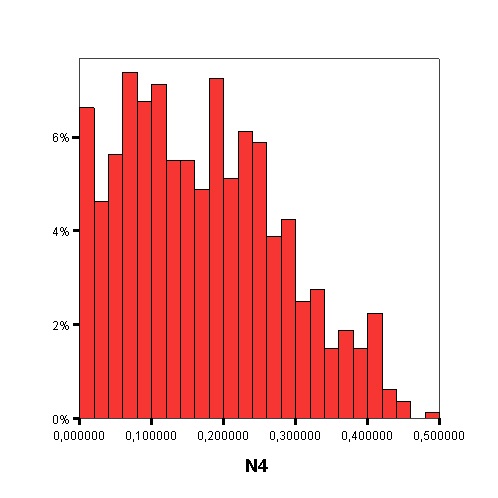
- N4 - Nonlinearity of the 1-NN classifier
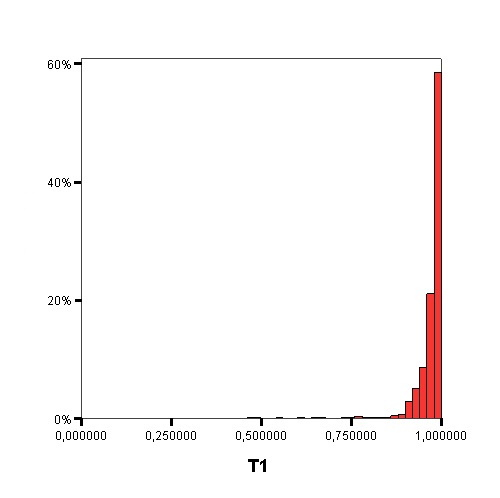
- T1 - Ratio of the number of hyperspheres, given by ε-neighborhoods, by the total number of points
Noise Filters
The noise filters analyzed in this paper are shown in the following table:
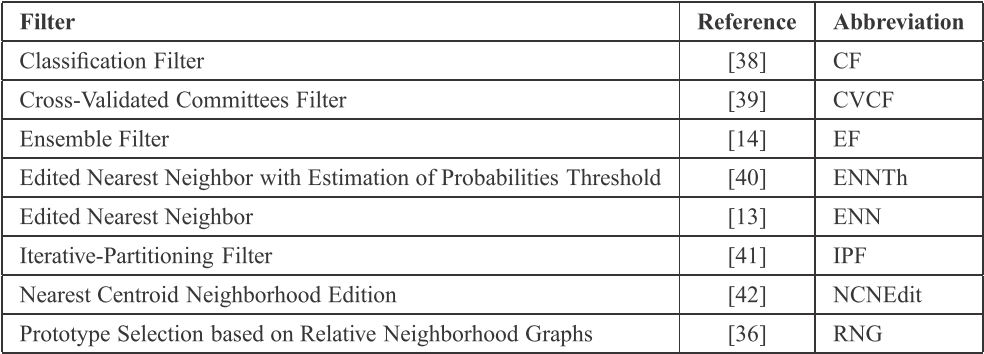
The implementation of these methods can be found in the KEEL Software Tool
Datasets and Results of 1-NN -with and without filtering
- Main datasets

- Results on main datasets

- Validation datasets
- Results on validation datasets
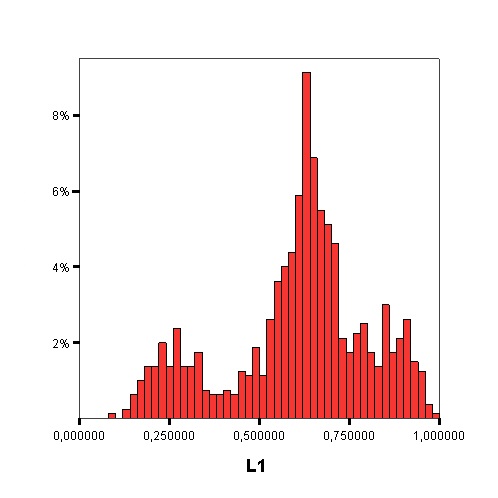
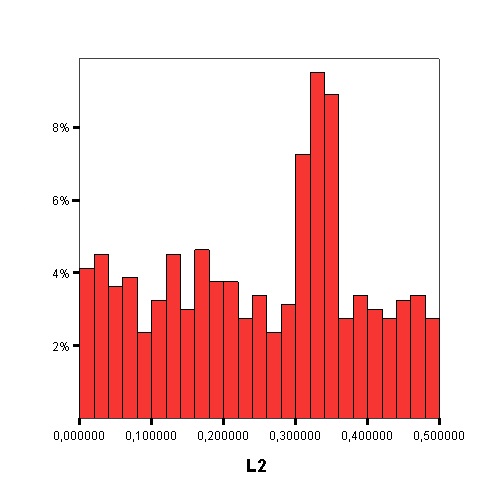
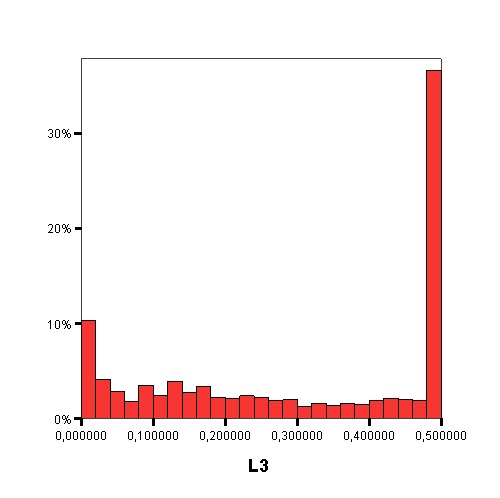
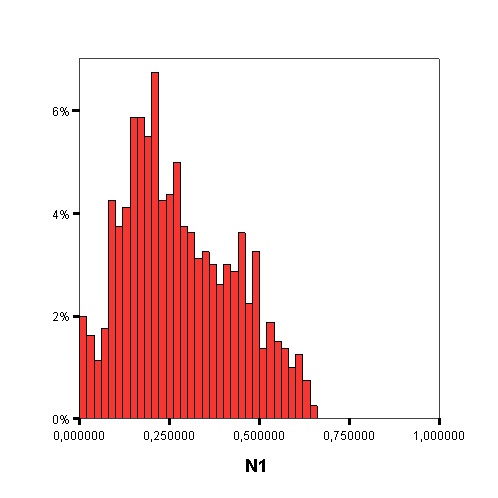
Distribution of values of each Data Complexity Measure
The file with the values of each data complexity measure can be downloaded here: ![]()
The following graphics show the histograms representing the distribution of values of each data complexity metric. The size of each interval is 0.1 for the F1 metric and 0.02 for the rest of measures.
 |
 |
 |
 |
 |
 |
 |
 |
 |
 |
 |